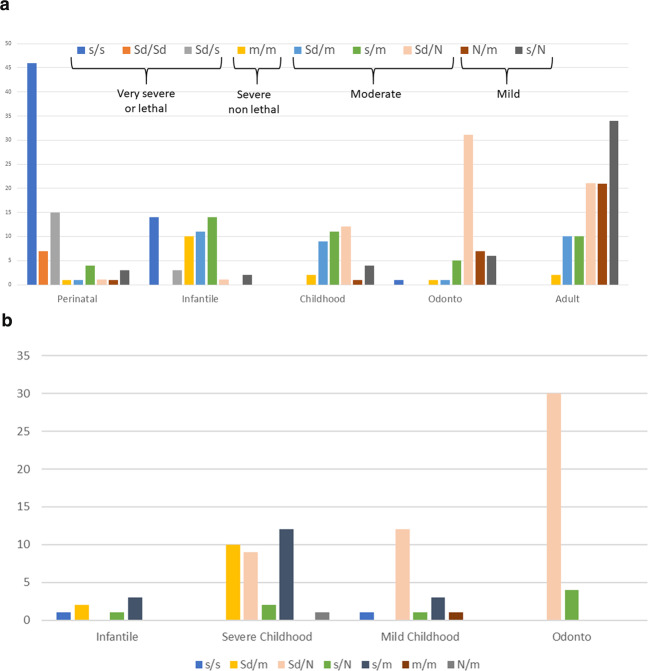
Fig. 2. Composition of genotypes in HPP phenotypes.
Only genotypes with classifiable alleles are included. a In our cohort. For each phenotype the figure shows the number of genotypes according to our classification of alleles. The prenatal benign form is not shown because this particular form is assumed to finally result in all but one (perinatal lethal) phenotypes. The distribution allow to sort genotypes according to resulting phenotypes: severe (divisible into into subgroups: very severe and severe), moderate and mild. N normal (wild type); Sd severe dominant; s severe recessive (i.e., no DNE); m moderate; b In the pediatric US cohort [10] for comparison.

