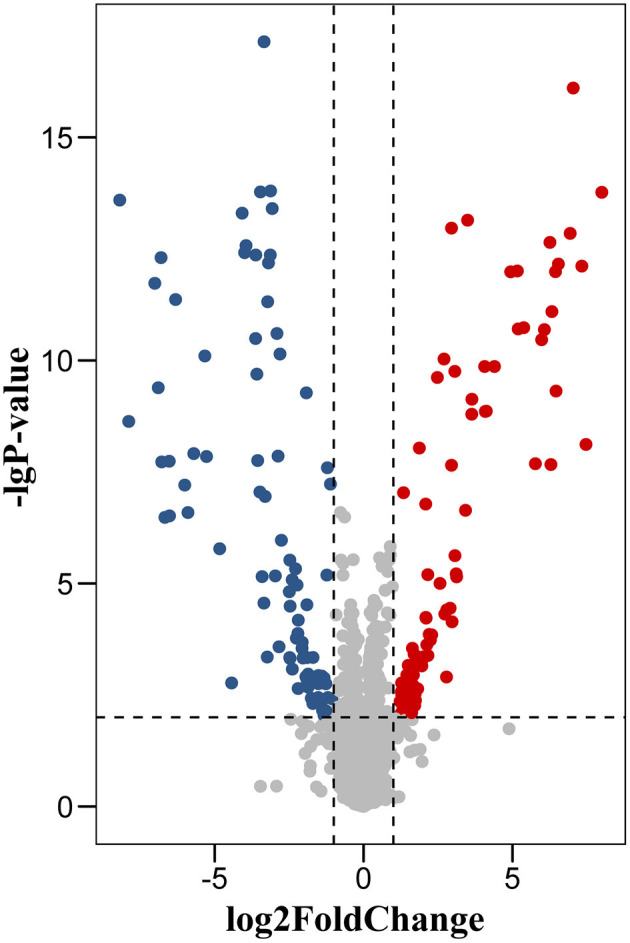
Figure 2.

Volcano plot of protein changes in dentate gyrus between TLE-HS patients and control groups. There were 172 proteins with a fold-change of >2 or <0.5 and p-values <0.01 were identified as the significant difference. Red dots represent upregulated proteins, blue dots are downregulated proteins.
