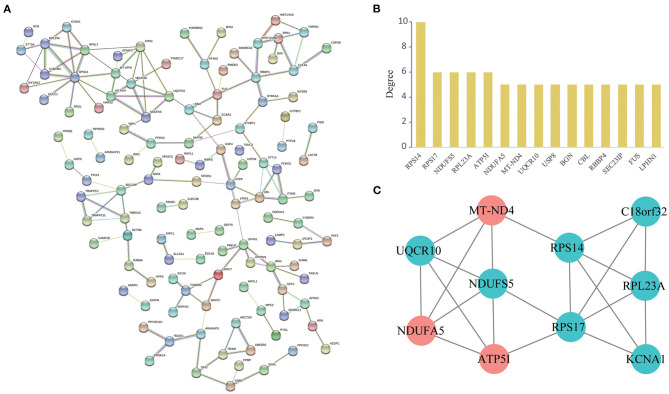
Figure 5.
PPI network and module analysis. (A): Protein-protein interaction network of differentially expressed genes by the STRING database. We identified 144 PPI pairs among 119 differentially expressed genes. (B): Degree distribution histogram of hub genes. (C): A significant module selected from the entire PPI network using the Cytoscape MCODE app with the default parameters (Degree cutoff ≥2, Node score cut-off ≥0.2, K-Core ≥2 and Max Depth = 100). Red nodes represent upregulated proteins and blue nodes represent downregulated proteins.

