Figure 3.
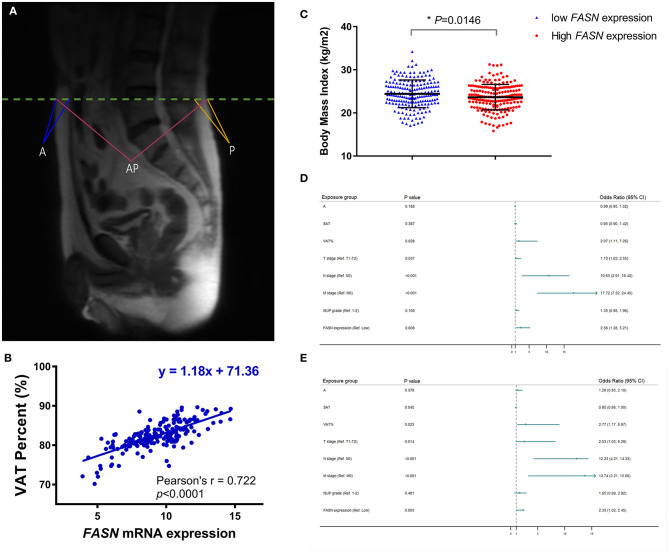
Anthropometric measurement of abdominal adipose and prognostic implication of VAT%. (A) The quantity of anthropometric measurements of SAT area was measured by MRI with T2-weighted sagittal localization images. (B) Pearson's correlation coefficient demonstrated that elevated FASN mRNA expression was positively correlated with the VAT% (r = 0.722, p < 0.0001). (C) BMI in ccRCC patients with low FASN expression is higher than that in patients with high expression of FASN (p = 0.0146). (D,E) In multivariate Cox regression analyses of PFS and OS in 117 ccRCC cases whose MRI scans were available from FUSCC cohort, high VAT% was significantly associated with poor PFS [HR = 2.066, p = 0.028; (D)] and OS [HR = 2.773, p = 0.023; (E)]. However, BMI was not an independent covariate affecting survival. In addition, advanced pT (HR = 1.132, p = 0.037), pN (HR = 10.63, p < 0.001), pM (HR = 17.72, p < 0.001), and FASN expression (HR = 2.578, p = 0.008) was significantly correlated with poorer PFS. SAT (HR = 0.955, p = 0.045), advanced pT (HR = 2.526, p = 0.014), pN (HR = 12.23, p < 0.001), pM (HR = 13.736, p < 0.001), and FASN expression (HR = 2.33, p = 0.003) was also markedly related with poor OS in 117 ccRCC cases.

