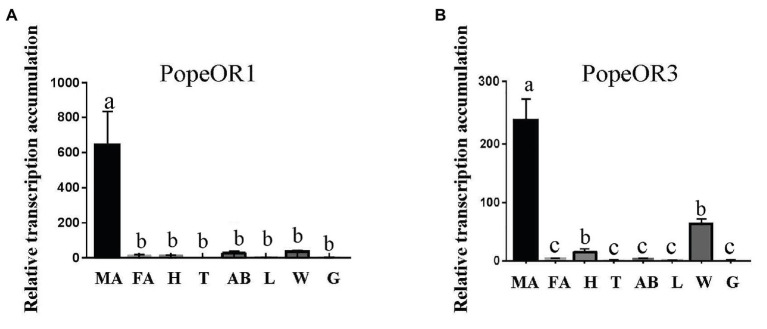
Figure 3.
Expression profiles of PopeOR1 (A) and PopeOR3 (B) genes in different tissues. MA, male antennae; FA, female antennae; H, heads (without antennae); T, thoraxes; AB, abdomens; L, legs; W, wings, G, genitalia. Error bars indicate standard error of three biological replicates. Different letters within the same figure mean that the values are significantly different under one-way ANOVA followed by Tukey’s honest significant differences (HSD) test (p < 0.05).

