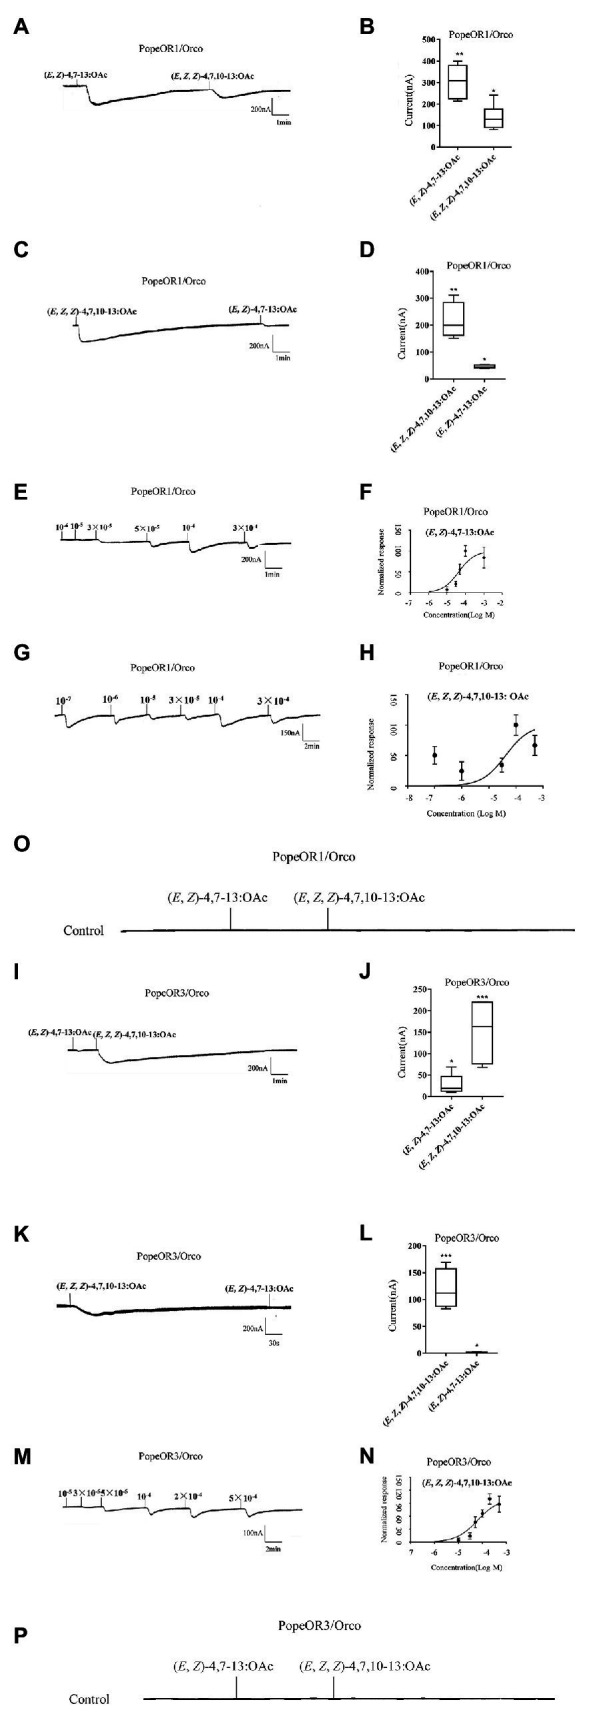
Figure 4.

ContinuedFunctional characterization of PopeOR1 and PopeOR3 in Xenopus oocytes. (A,I) Inward current responses of PopeOR1/Orco and PopeOR3/Orco expressed Xenopus oocytes in response to a 10−4 mol/L solution of tested compounds. (B,J) Boxplots of tested compounds response profile of PopeOR1/Orco and PopeOR3/Orco expressed Xenopus oocytes. (C,K) Inward current responses of PopeOR1/Orco and PopeOR3/Orco expressed Xenopus oocytes in response to a 10−4 mol/L solution of tested compounds (reverse stimuli order). (D,L) Boxplots of tested compounds response profile of PopeOR1/Orco and PopeOR3/Orco expressed Xenopus oocytes (reverse stimuli order). (E) PopeOR1/Orco expressed Xenopus oocytes stimulated by a series of concentrations of (E, Z)-4,7–13: OAc. (F) Dose-response curves of PopeOR1/Orco expressed Xenopus oocytes to (E, Z)-4,7–13: OAc. Responses were normalized by setting the maximal response to 100. EC50 values were calculated to be 7.3 × 10⁻⁵ M. (G) PopeOR1/Orco expressed Xenopus oocytes stimulated by a serious of concentrations of (E, Z, Z)-4,7,10–13: OAc. (H) Dose-response curves of PopeOR1/Orco expressed Xenopus oocytes to (E, Z, Z)-4,7,10–13: OAc. Responses were normalized by setting the maximal response to 100. EC50 values were calculated to be 3.9 × 10⁻⁵ M. (M) PopeOR3/Orco expressed Xenopus oocytes stimulated by a range of concentrations of (E, Z, Z)-4,7,10–13: OAc. (N) Dose-response curves of PopeOR3/Orco expressed Xenopus oocytes to (E, Z, Z)-4,7,10–13: OAc. Responses were normalized by setting the maximal response to 100. EC50 values were calculated to be 8.9 × 10⁻⁵ M. Error bars indicate SEM (n = 6). (O,P) Negative control of PopeOR1/Orco and PopeOR3/Orco expressed Xenopus oocytes stimulated by tested compounds. Significance is indicated by asterisk.
