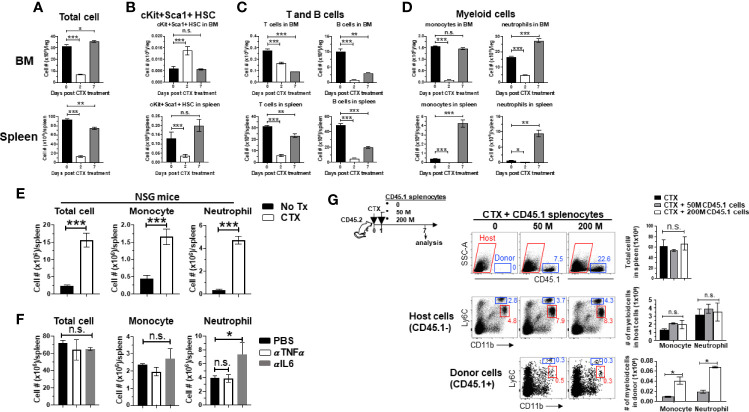
Figure 1.
Myeloid cell expansion after CTX is inherent to the hematopoietic recovery process in host response to non-myeloablative chemotherapy. (A to D) The kinetics of immune cell recovery in mice after CTX treatment. Naïve Balb/c mice were untreated or treated with 150 mg/kg CTX. At the indicated time points, cells from spleens and BMs were enumerated and analyzed for the frequencies of HSCs (Lin-cKit+Sca1+), B cells (CD19+B220+), T cells (CD3+), monocytes (CD11b+Ly6Chi), and neutrophils (CD11b+Ly6Clo) by flow cytometry. The numbers of total cells (A), HSCs (B), T and B cells (C), monocytes and neutrophils (D) in spleens and BMs are summarized in the bar graphs. The formula for calculating the cell number of each specified cell population is: total cell number x percent of specific cell population. Results are shown as mean ± SD of at least three mice per group at each time point. (E) CTX-driven myeloid cell expansion in mice is independent of the adaptive immune system. NSG mice were not treated or treated with CTX. 7 days later, spleen cells were enumerated and stained for CD11b and Ly6C to determine the absolute number of monocytes and neutrophils. Results are summarized in bar graphs and shown as mean ± SD of three mice each group. (F) Neutralization of TNFα or IL6 does not affect CTX-induced myeloid cell expansion. Naïve Balb/c mice were treated with CTX. A cohort of mice were further treated with TNFα or IL6 neutralizing monoclonal antibody (100 µg/injection in 200 ul PBS) by daily intraperitoneally injection for 5 days, starting 1 day after CTX treatment. On day 7 after CTX treatment, spleens were collected for flow cytometry analysis. The absolute number of each myeloid cell subset in the spleens from the mice with different treatments are summarized in bar graphs. Data are shown as mean ± SD with at least three mice per group. (G) Filling the “space” created by CTX-induced lymphodepletion with bystander cells does not affect the expansion of the endogenous myeloid cells. Following the timeline depicted in the schema, naïve Balb/c (CD45.2+/+) mice were treated with CTX followed by adoptive transfer of increasing numbers of splenocytes derived from CD45.1+/+ mice the next day. 7 days after CTX treatment, spleens were collected and processed for flow cytometry analysis. Representative dot plots shown in the top panel indicate the presence of the CD45.1+ bystander donor cells. Numbers in dot plots represent the frequencies of donor cells in total splenocytes. The absolute numbers of total spleen cells shown as mean ± SD are summarized in the bar graph on the right. The frequencies of monocytes and neutrophils in the host (CD45.1-, middle panel) and donor (CD45.1+, bottom panel) splenocytes are shown in representative dot plots. The absolute numbers of monocytes and neutrophils in the host or donor splenocytes are summarized in bar graphs shown as mean ± SD of four samples per group. n.s., not significant, *p < 0.05, **p < 0.01, ***p < 0.001.

