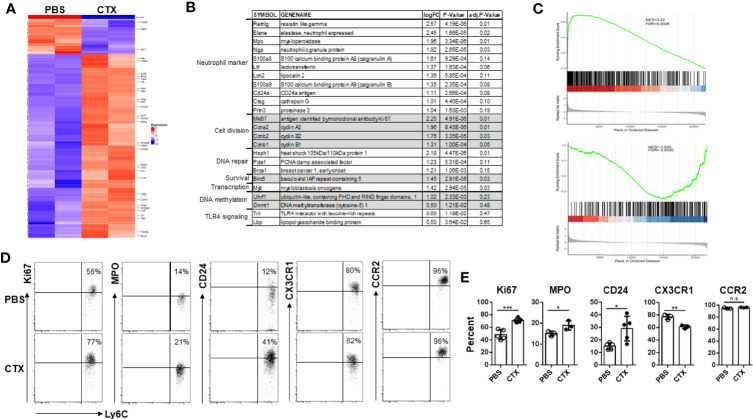
Figure 5.
Microarray analysis reveals the emergence of neutrophil-like monocytes in CTX-treated mice. (A) Heatmap showing the differential gene expression profiles of monocytes from CTX-treated vs. control mice. 7 days after CTX treatment, CD11b+Ly6Chi monocytes were flow-sorted from splenocytes. Monocytes from untreated naïve Balb/c splenocytes were used as control. Total RNA was isolated and subjected to microarray analysis using Affymetrix GeneChip. 96 differentially expressed genes (absolute logFC ≥ 1 and FDR <0.2) identified by limma package were used for Hierarchical clustering. (B) A list of candidate genes significantly upregulated in monocytes from CTX-treated mice compared to monocytes from untreated mice. Genes with similar functions are grouped together. (C) GSEA results demonstrating enrichment of gene signature characteristic of neutrophil-like monocytes in differentially expressed genes induced by CTX-treatment. Genes up- or down-regulated in neutrophil-like monocytes were derived from a publicly available scRNAseq dataset (GSE104478) and used as separate gene sets for comparison with rank sorted gene expression (logFC) in monocytes between CTX-treated vs. control mice. (D) Naïve Balb/c mice were untreated or treated with 150 mg/kg CTX. 7 days after treatment, spleens were processed and the differential expressions of a panel of molecules in monocytes from untreated and CTX-treated mice were confirmed by flow cytometry. Numbers in dot plots indicate percentage of cells in the corresponding quadrant. The results of flow cytometry analysis are summarized in bar graph (E). The results are shown as mean ± SD with at least three mice per group. n.s., not significant, *p < 0.05, **p < 0.01, ***p < 0.001.

