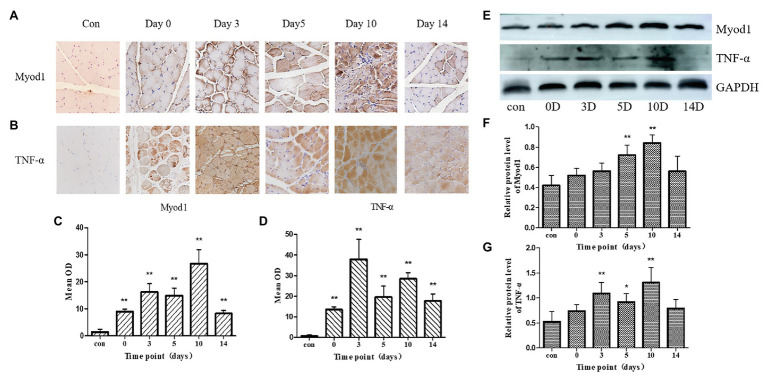
Figure 4.
(A,B): immunohistochemical pictures of Myod1 and TNF-α at control and frostbite (0, 3, 5, 10, and 14 days). (C,D): mean optical density (OD) of Myod1 and TNF-α in control group and frostbite groups. (E) Western blot pictures of Myod1 and TNF-α. (F,G): protein expression of Myod1 and TNF-α in control group and frostbite groups. Scale bar, 200 μm. OD, optical density. *p < 0.05, **p < 0.01.

