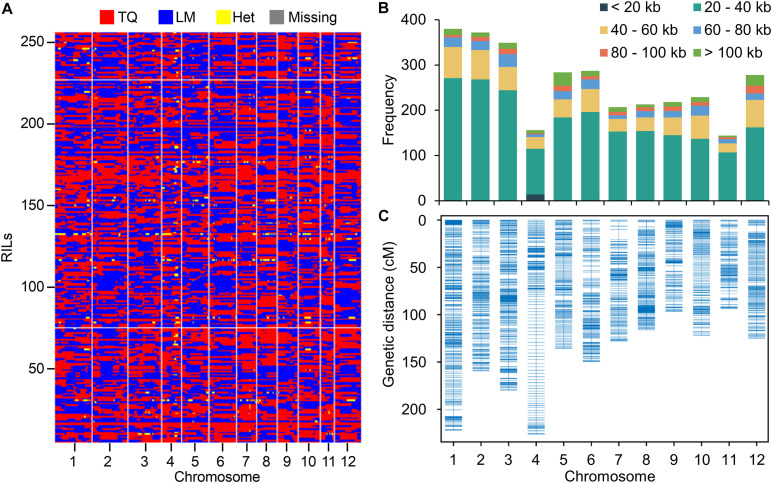
FIGURE 1.
Resequencing RIL population and genetic linkage map construction. (A) Recombination bin map of 257 RILs. The red, blue, yellow and gray colors represent the genotypes of TQ and LM, the heterozygous genotype (Het), and the missing data. (B) The frequency of bins with different lengths on each chromosome. (C) Genetic linkage map of RIL population by using bins as markers.

