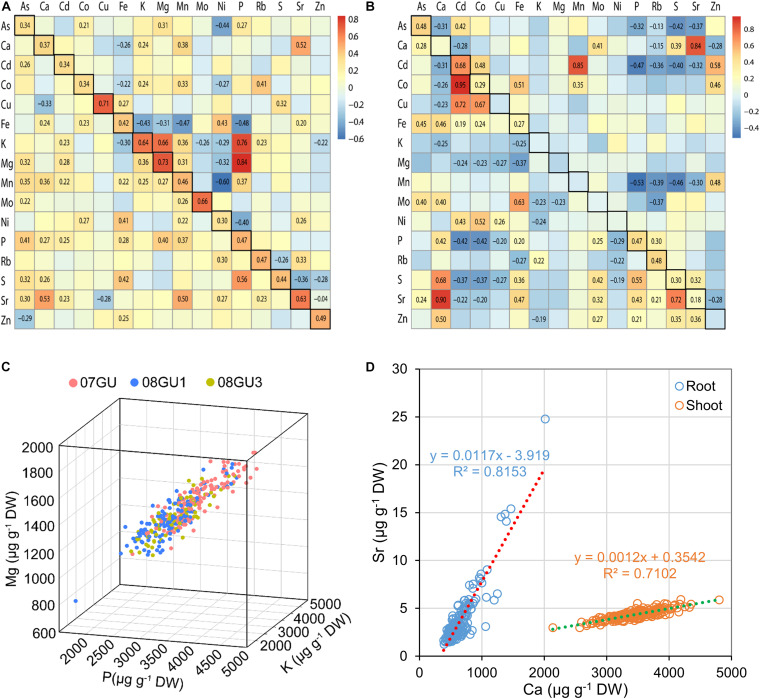
FIGURE 2.
The correlations of elemental concentrations in the RIL population. (A) The correlations of elemental concentrations in grains of LT-RILs grown under unflooded condition (upper right triangular matrix) or in a greenhouse (lower left triangular matrix). The squares with black frames on the left diagonals are the correlations of the same elements in grains of RILs grown under flooded and unflooded condition. (B) The correlations of elemental concentrations in shoots (upper right triangular matrix) and roots (lower left triangular matrix) of RILs grown hydroponically. The squares with black frames on the left diagonals are the correlations of the same elements between shoots and roots. The Pearson’s correlation coefficients (r) were calculated between each pair of all 16 elements based on the mean of elemental concentrations in different tissues. Only the r values with significance levels at p < 0.01 were shown on the heat maps. (C) The correlation of concentrations of P, Mg, K in the grains of LT-RILs grown under unflooded condition. (D) The correlation of Ca and Sr concentrations in the shoots and roots of LT-RILs grown hydroponically.

