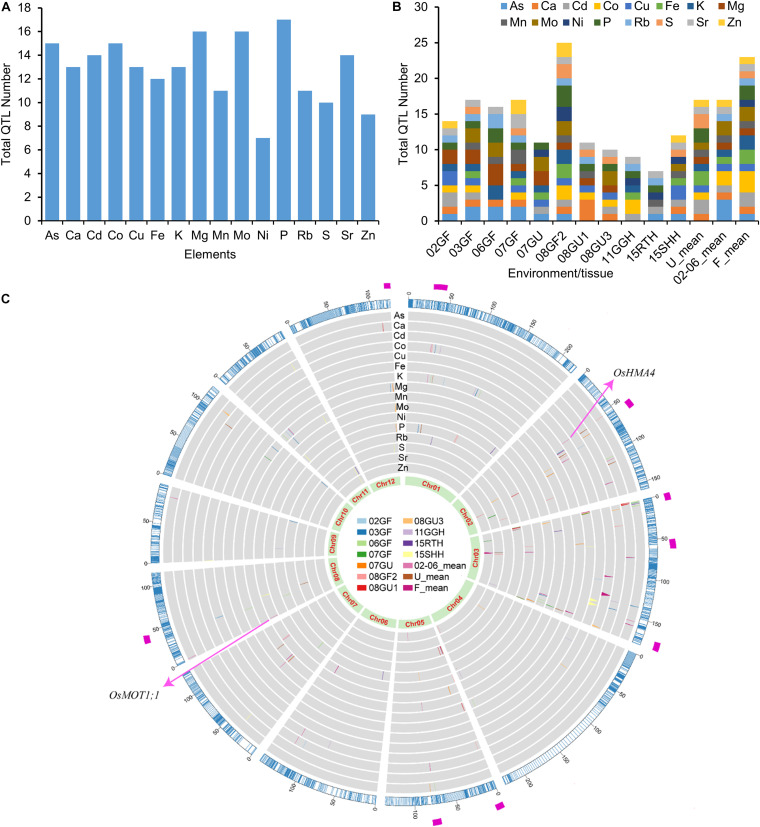
FIGURE 3.
QTL numbers and distribution of elemental QTLs on the genetic linkage map. (A) Total QTL numbers identified for each element. (B) Total QTL numbers identified in different environments or tissues. (C) Distribution of elemental QTLs on the genetic linkage map. The outer ring in blue color is the genetic linkage map scaled with genetic distance (cM). The inner rings in gray background are the distribution of QTLs for the concentrations of 16 elements. QTLs identified from different years or tissues are presented in different colors as shown in the middle. The most inner ring shows the 12 rice chromosomes. The magenta rectangle in the most outer ring highlights the QTL hotpots. 02GF, 03GF, 06GF, 07GF and 07GU are grains (G) of RILs grown under flooded (F) or unflooded (U) conditions in 2002, 2003, 2006 and 2007, respectively; 08GF2, 08GU1 and 08GU3 are grains (G) of RILs grown under flooded (F) or unflooded (U) condition on 2008 in the field site number 2, 1 and 3; 11GGH is the grains (G) of RILs grown in a greenhouse (GH) condition on 2011; 15RTH and 15SHH are roots (RT) or shoots (SH) of RILs grown hydroponically (H) on 2015. 02-06_mean: the LS mean of 02GF, 03GF and 06GF; U_mean: the LS means of 07GU, 08GU1 and 08GU3; F_mean: the LS means of 02GF, 03GF, 06GF, 07GF and 08GF2.

