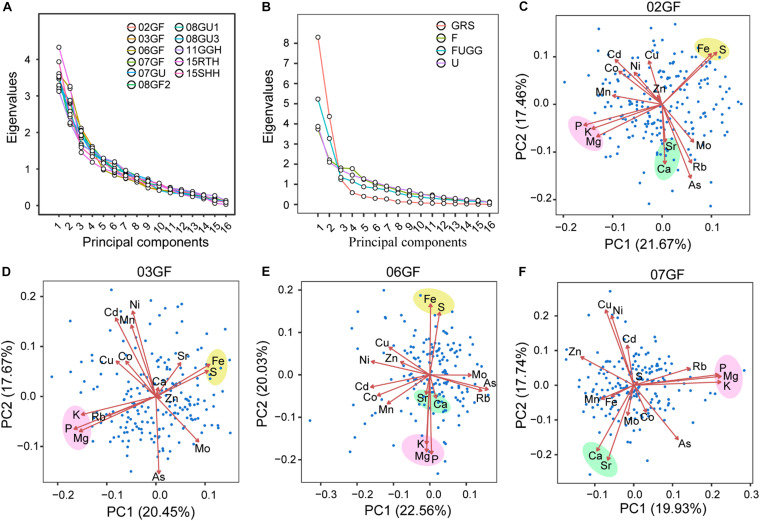
FIGURE 5.
PCA plots in different environments or tissues. (A,B) Screeplots of 16 principle components of individual environment or tissue (A) or across environments or tissues (B). (C–F) Biplots of 02GF (C), 03GF (D), 06GF (E) and 07GF (F). The biplots showed the PC1 and PC2 loadings of each elements in indicated environments. The correlated elements with similar PC direction and magnitude were highlighted in color background. 02GF, 03GF, 06GF, 07GF and 07GU are grains (G) of RILs grown under flooded (F) or unflooded (U) conditions on 2002, 2003, 2006 and 2007, respectively; 08GF2, 08GU1 and 08GU3 are grains (G) of RILs grown under flooded (F) or unflooded (U) condition on 2008 in the field site number 2, 1 and 3; 11GGH is the grains (G) of RILs grown in a greenhouse (GH) condition on 2011; 15RTH and 15SHH are roots (RT) or shoots (SH) of RILs grown hydroponically (H) on 2015. F: 02GF+03GF+06GF+07GF+08GF2; U: 07GU+08GU1+08GU3; FUGG: F+U+11GGH; GRS: FUGG+15RTH+15SHH.

