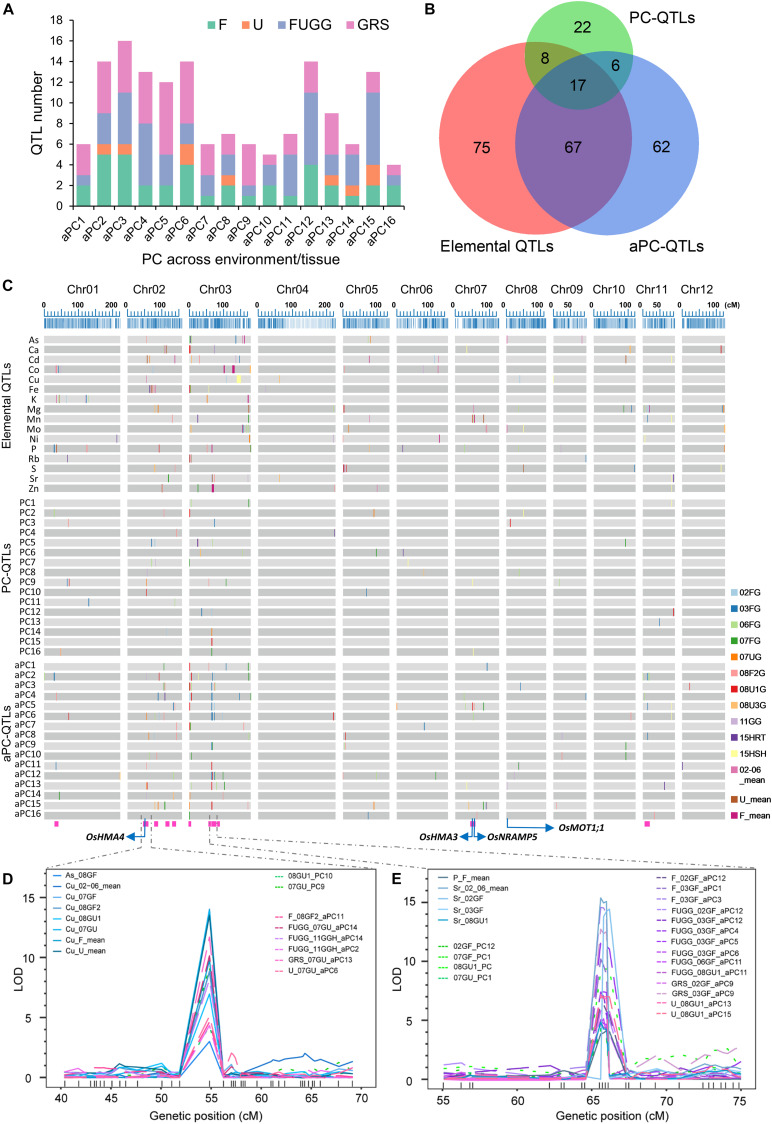
FIGURE 6.
Identification of PC-QTLs and aPC-QTLs. (A) Total number of aPC-QTLs identified across different environments or tissues. (B) The overlapped number of elemental QTLs, PC-QTLs and aPC-QTLs as revealed by a Venn diagram. (C) Distribution of elemental QTLs, PC-QTLs and aPC-QTLs on the 12 linkage groups of the genetic map. Elemental QTLs were separated by elements; PC-QTPs and aPC-QTLs were separated by PCs. QTLs detected in different environments or tissues are shown in different colors. The magenta rectangles at the bottom highlight the positions of the QTL clusters. The blue arrows show the positions of four candidate genes: OsHMA4, OsHMA3, OsNRAMP5 and OsMOT1;1. (D,E) The LOD values of super QTLs with co-localization of elemental QTLs, PC-QTLs and aPC-QTLs on chromosome 2 (D) and chromosome 3 (E). Elemental QTLs, PC-QTLs and aPC-QTLs are shown as solid lines, dot lines and break lines, respectively. Genetic markers are shown in the bottom of each figures. 02GF, 03GF, 06GF, 07GF and 07GU are grains (G) of RILs grown under flooded (F) or unflooded (U) conditions on 2002, 2003, 2006, and 2007, respectively; 08GF2, 08GU1 and 08GU3 are grains (G) of RILs grown under flooded (F) or unflooded (U) condition on 2008 in the field site number 2, 1 and 3; 11GGH is the grains (G) of RILs grown in a greenhouse (GH) condition on 2011; 15RTH and 15SHH are roots (RT) or shoots (SH) of RILs grown hydroponically (H) on 2015. F: 02GF+03GF+06GF+07GF+08GF2; U: 07GU+08GU1+08GU3; FUGG: F+U+11GGH; GRS: FUGG+15RTH+15SHH.

