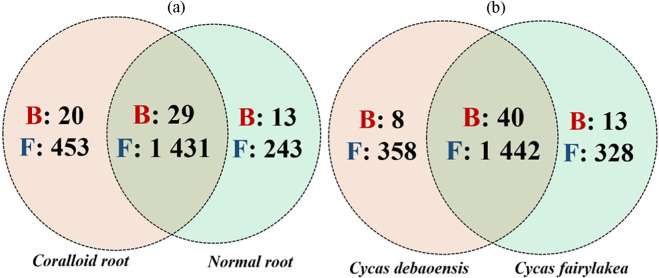
Figure 1.
Venn diagram displayed the unique and overlapping OTUs of bacteria (B; red color, bold type) and fungi (F; blue color, bold type) between root types and host species. The total number of OTUs were accounted and compared: (a) between normal and coralloid roots regardless of the host species and (b) between Cycas debaoensis and Cycas fairylakea regardless of root types.

