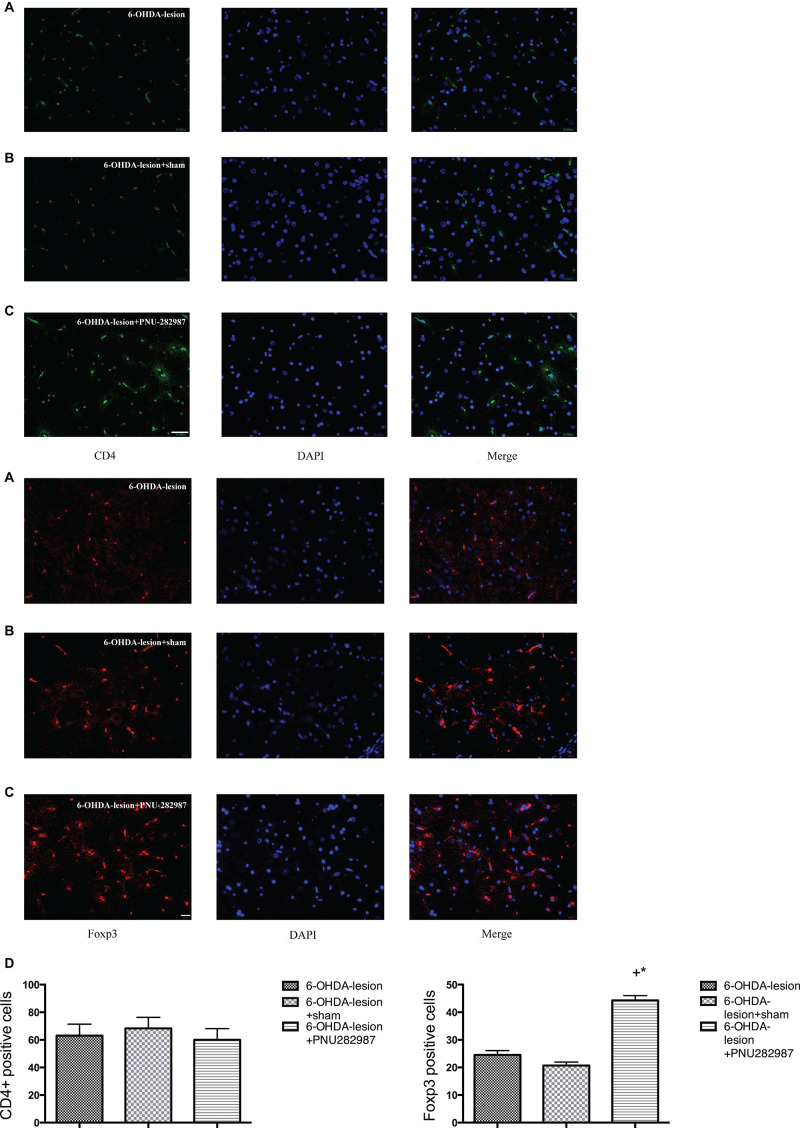
FIGURE 5.
PNU-282987 changes the subsets of CD4+ T lymphocytes and Foxp3 cells in the SN. The immunofluorescence staining of Foxp3/DAPI was performed using antibodies against: CD4 (green stain) and Foxp3 (red stain) and DAPI (blue stain). Merged image showing CD4 or Foxp3 and DAPI staining (n = 6 per group). The scale bar indicates 200 and 20 μm, respectively. (A) 6-OHDA-lesion group; (B) 6-OHDA-lesion + sham group; (C) 6-OHDA-lesion + PNU-282987 group. (D) The graph depicts the positive number of CD4+ cells and Foxp3 cells in the SN from each experimental group. +p < 0.05 compared with the 6-OHDA-lesion group (n = 6 per group), and *p < 0.05 compared with the 6-OHDA-lesion + sham group (n = 6 per group).

