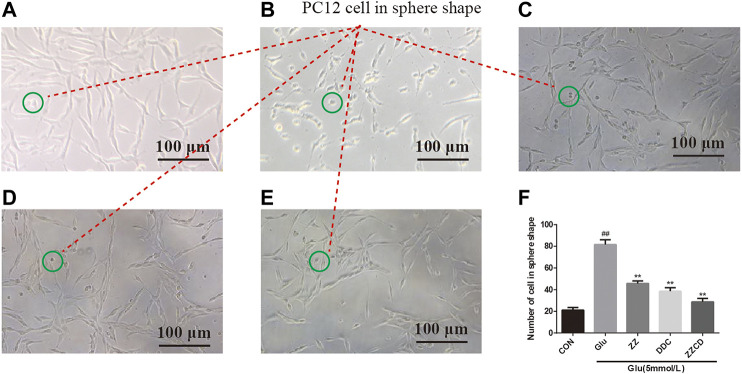
Figure 3.
Morphology of PC12 cells in CON (A), Glu (B), ZZ (C), DDC (D), and ZZCD (E) group. Scale bar = 100 μm. The cell in green circle was considered as PC12 cell in sphere shape. Number of PC12 cells in sphere shape (F). ## p < 0.01 vs. control. **p < 0.01 vs. cells treated with glutamate alone (n = 3).

