Figure 5.

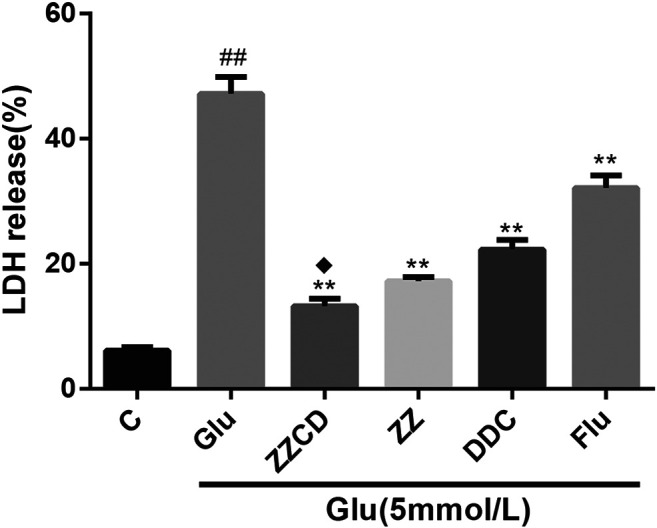
The release of LDH in glutamate treated PC12 cells. ## p < 0.01 vs. control. **p < 0.01 vs. cells treated with glutamate alone. ♦ p < 0.05 vs. cells treated with ZZ or DDC (n = 3).

The release of LDH in glutamate treated PC12 cells. ## p < 0.01 vs. control. **p < 0.01 vs. cells treated with glutamate alone. ♦ p < 0.05 vs. cells treated with ZZ or DDC (n = 3).