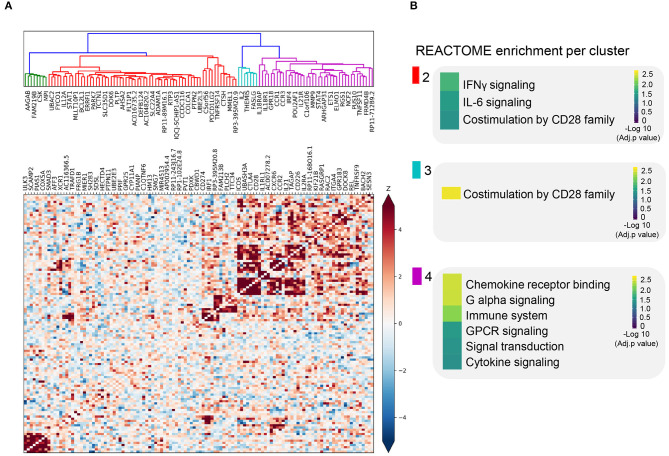
Figure 2.
Co-expression pattern of cis-eQTL prioritized genes. (A) Heatmap showing the Spearman correlations between gene expression patterns of each prioritized gene. Blue squares indicate a negative correlation. Red squares indicate a positive correlation. Both are shaded on a gradient scale according to the Z score of the correlation. A dendrogram computed with Ward distances between the correlations is shown on top of the heatmap. Branches of the dendrogram are colored differently to mark separate clusters. (B) Results of the REACTOME gene set enrichment analysis of the genes belonging to each of the clusters identified in (A). Color key denotes the significance (-log 10 multiple testing adjusted p-value) of each biological pathway.

