. 2021 Feb 4;41(1):14-23. doi: 10.5144/0256-4947.2021.14
Copyright © 2021, Annals of Saudi Medicine, Saudi Arabia
This is an open access article under the Creative Commons Attribution-NonCommercial-NoDerivatives 4.0 International License (CC BY-NC-ND). The details of which can be accessed at http://creativecommons.org/licenses/by-nc-nd/4.0/
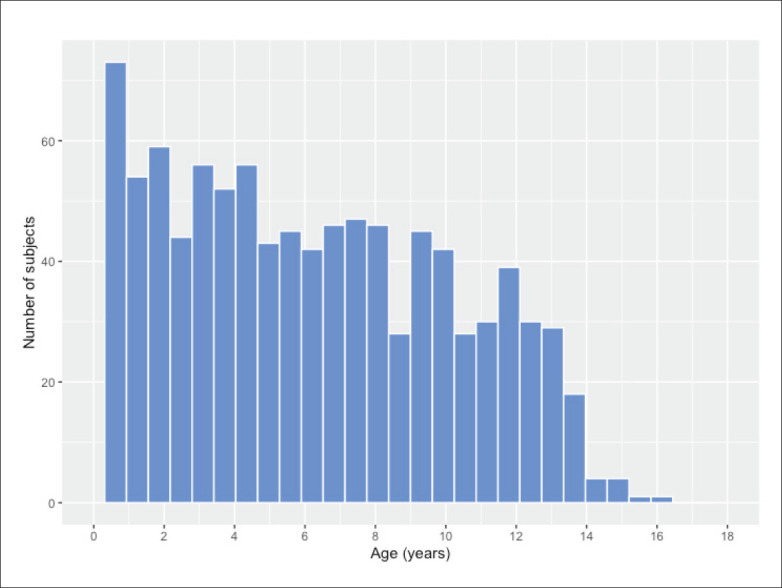
Figure 2. Age distribution of the study population (n=1028).