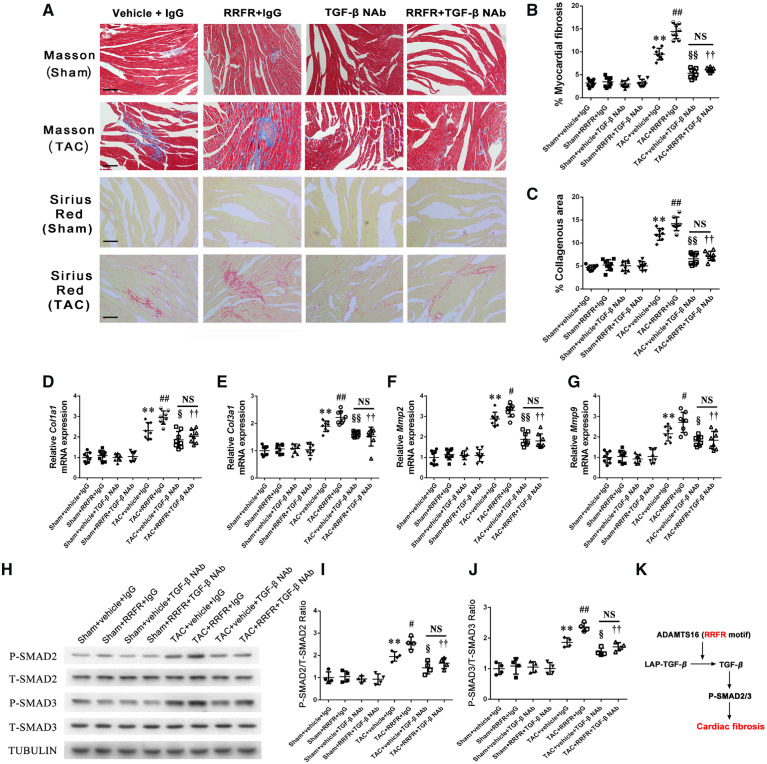
Figure 7.
The RRFR peptide accelerates cardiac fibrosis. (A) Masson staining (upper panel) and typical Sirius Red staining (lower panel) of the hearts in sham mice and TAC mice with pressure overloading for 8 weeks. The myocardial fibrosis and collagenous area of the hearts are graphed for different groups of mice (n = 8). Scale bar = 100 μm, and the quantified data are shown at the right (B) and (C). (D–G) represent the effects of the RRFR peptide treatment combined with TGF-β NAb or IgG on the mRNA expression levels for Col1a1, Col3a1, Mmp2, and Mmp9 in mice after 8 weeks of TAC (n = 8). (H) Western blot analysis showing the effects of the combined treatment of the RRFR peptide with TGF-β NAb or IgG on levels of SMAD2/3 phosphorylation in mice after 8 weeks of TAC operation (n = 8). The quantified data are shown at the right (I) and (J). (K) Diagram showing the molecular signalling pathway for ADAMTS16 as a central activator of TGF-β to accelerate cardiac fibrosis, cardiac hypertrophy, and heart failure. Data are shown as mean ± SD. **P < 0.01 vs. Sham+vehicle+IgG group; #P < 0.05, ##P < 0.01 vs. TAC+vehicle+IgG group; §P < 0.05, §§P < 0.01, vs. TAC+vehicle+IgG group; ††P < 0.01 vs. TAC+RRFR+IgG group. NS, not significant. Statistical analysis was carried out by a one-way ANOVA test.

