
Figure 6.
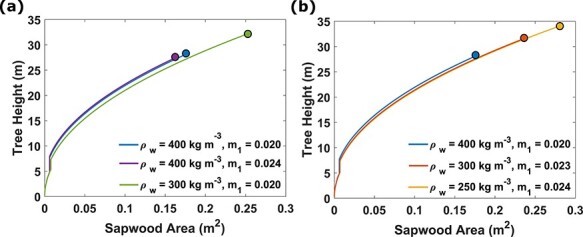
The model predicts that a tree with lower wood density (ρw) and higher mortality (m1) grows to a larger size. We compare growth trajectories for trees with lower wood density or higher mortality (a) and examine the change in growth trajectory when wood density and mortality are changed simultaneously (b). The relationship between the wood change in density and mortality was calculated  , and the number
  m3 kg−1 was determined as the mean slope from Figure 1 in Iida et al. (2012). The circle at the end of each growth trajectory signals the final size, and when seed production starts. All trees were subjected to the same light condition (height at maximum light gradient, HdQmax = 10 m, maximum light gradient, dQmax = 0.25 m−1 and initial light level, Q0 = 0.27).