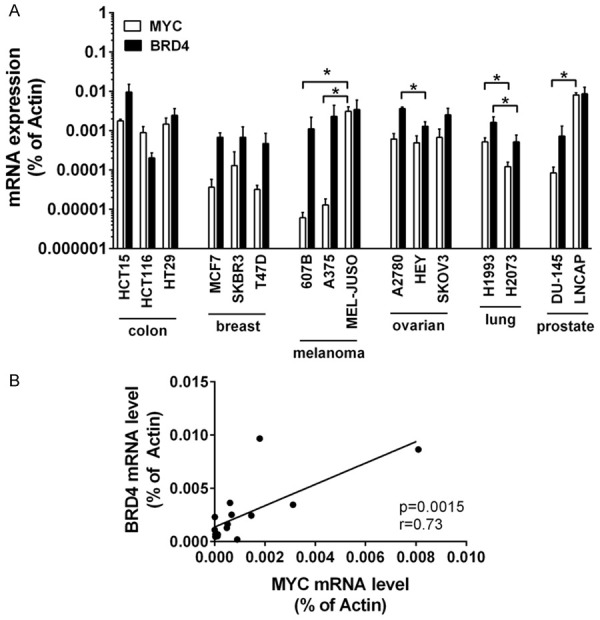
Figure 1.

Baseline expression of MYC and BRD4 mRNA in untreated solid tumor cells. A. Baseline expression of MYC and BRD4 mRNA was determined by qPCR analysis. The relative expression levels of MYC and BRD4 mRNA were calculated by the standard curve method and Actin was used as internal control. The figure shows the mean ± SD of 3 independent determinations. Please note that the y-axis is displayed on a logarithmic scale. Statistical analysis was performed using ANOVA and post hoc Scheffe test to compare either MYC mRNA levels between individual cell lines of the same tissue origin or BRD4 mRNA levels between individual cell lines of the same tissue origin. Asterisk (*): P < 0.05. B. Pearson correlation analysis between MYC mRNA level and BRD4 mRNA level across all cell lines revealed a highly significant (P = 0.0015) strong positive linear correlation with an r-value of 0.73.
