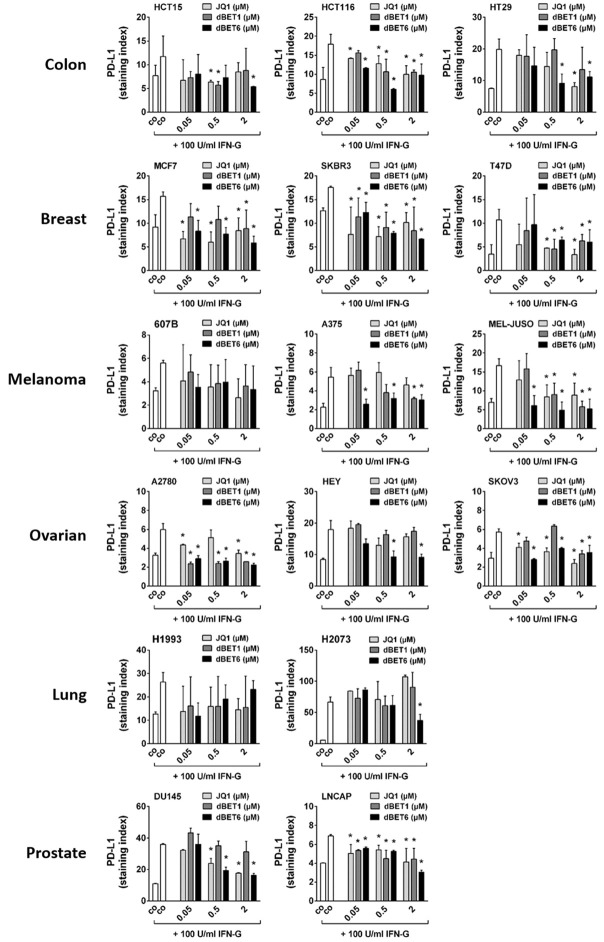
Figure 6.
Effect of BRD4 targeting drugs on interferon-gamma induced PD-L1 expression in solid tumor cells. Cancer cell lines were incubated in control medium (co) without or with 100 U/ml interferon-gamma alone or in combination with various concentrations (0.05, 0.5, 2 µM) of JQ1, dBET1 or dBET6 at 37°C for 24 hours. Then, PD-L1 expression was determined by flow cytometry. Expression levels are provided as staining index (SI) defined by the ratio of median fluorescence intensities (MFI) obtained with specific PD-L1 mAb and isotype-matched control mAb (SI = MFIPD-L1 mAb:MFIcontrol mAb). Statistical analysis was performed by using ANOVA and post hoc Scheffe test. Results represent the mean ± SD of at least 3 independent experiments. Asterisk (*): P < 0.05 compared to IFN-G treated control (co) cells.

