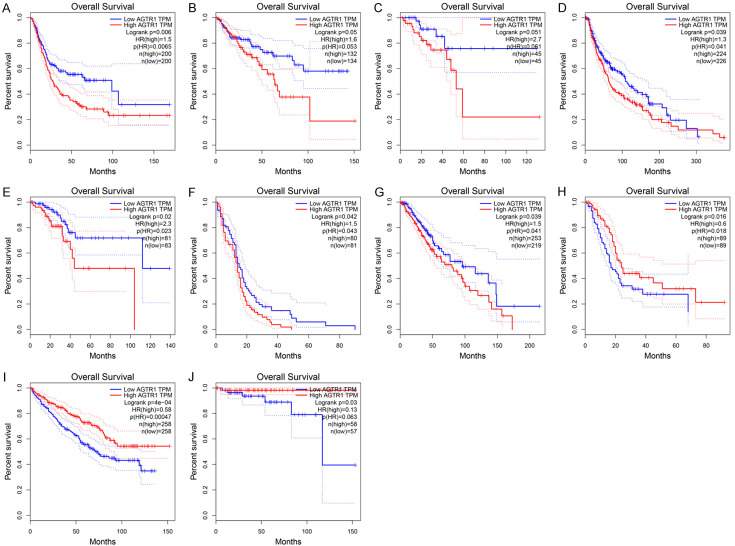
Figure 3.
The effect of high expression of AGTR1 in tumor tissue on the survival of patients. The median expression level of AGTR1 was divided into one-to-one groups. A. Bladder urothelial carcinoma (BLCA); B. Colon adenocarcinoma (COAD); C. Rectal adenocarcinoma (READ); D. Skin cutaneous melanoma (SKCM); E. Uterine corpus endometrial carcinoma (UCEC); F. Glioblastoma multiforme (GBM); G. Brain lower-grade glioma (LGG); H. Pancreatic adenocarcinoma (PAAD); I. Kidney renal clear cell carcinoma (KIRC); J. Thymoma (THYM). The data was obtained through Gene Expression Profiling Interactive Analysis (GEPIA).

