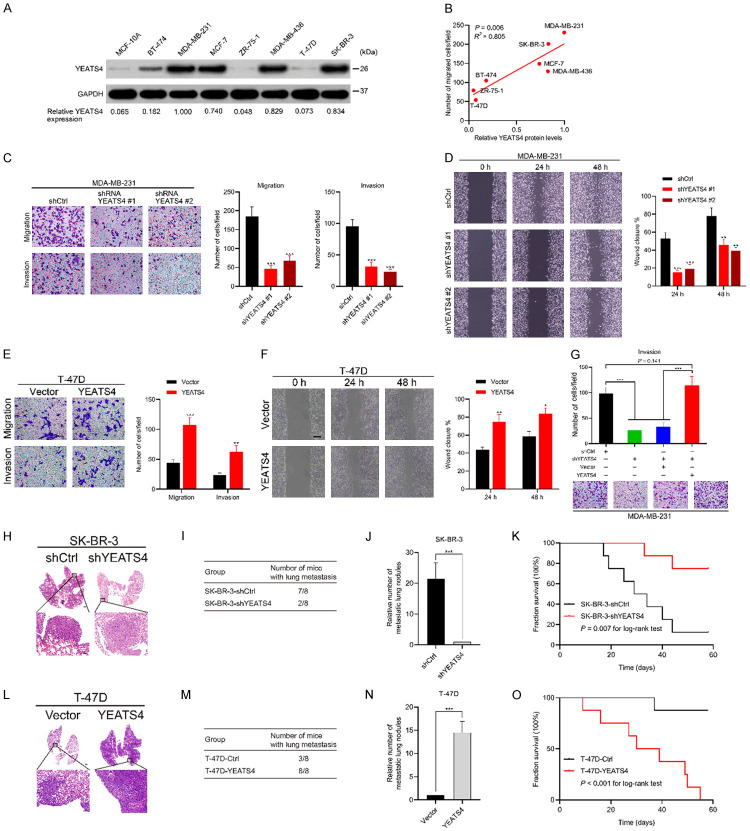
Figure 5.
YEATS4 promotes cell migration and invasion in breast cancer cells in vitro and in vivo. (A) YEATS4 expression detected in several breast cancer cell lines by Western blot analysis. Relative expression of YEATS4 to GAPDH is shown below. (B) Correlation analysis between relative YEATS4 expression and migration ability of cancer cells by using the Pearson correlation method. (C) Migration and invasion capabilities assessed in MDA-MB-231 cells stably infected with lentivirus carrying YEATS4 shRNAs or negative control shRNA (shCtrl) by transwell assays. Scale bar, 50 µm. (D) Migration ability in MDA-MB-231 cells transfected with YEATS4 shRNAs or shCtrl by wound healing assays. Scale bar, 200 µm. (E) Migration and invasion abilities in stable T-47D-YEATS4 cells, determined using transwell assays. Scale bar, 50 µm. (F) Migration capability in stable T-47D-YEATS4 cells, detected by using wound healing assays. Scale bar, 200 µm. (G) YEATS4 was first downregulated by shYEATS4 expressing lentiviruses infection. These cells were then infected with YEATS4 overexpression lentiviruses or control vector overexpression lentiviruses. These different groups of MDA-MB-231 cells were subjected to transwell invasion assays. Scale bar, 50 µm. (H-K) Stable SK-BR-3-shYEATS4 or negative control cells intravenously injected into mice in lung metastasis assays (n = 8 for each group). Representative images of H&E-stained lung tissues from the different groups (H). Scale bar, 1 mm for upper panel and 100 µm for lower panel. Number of nude mice with lung metastasis in each group (I). Relative number of lung metastasis nodules in each group (J). Overall survival time in the different groups of nude mice (K). (L-O) T-47D-YEATS4 or control cells intravenously injected into mice in lung metastasis assays (n = 8 for each group). Representative images of H&E-stained lung tissues from the different groups (L). Scale bar similar to that in (H). Number of nude mice with lung metastasis in each group (M). Relative number of lung metastasis nodules in each group (N). Overall survival time in the different groups of nude mice (O). **, P < 0.01; ***, P < 0.001.

