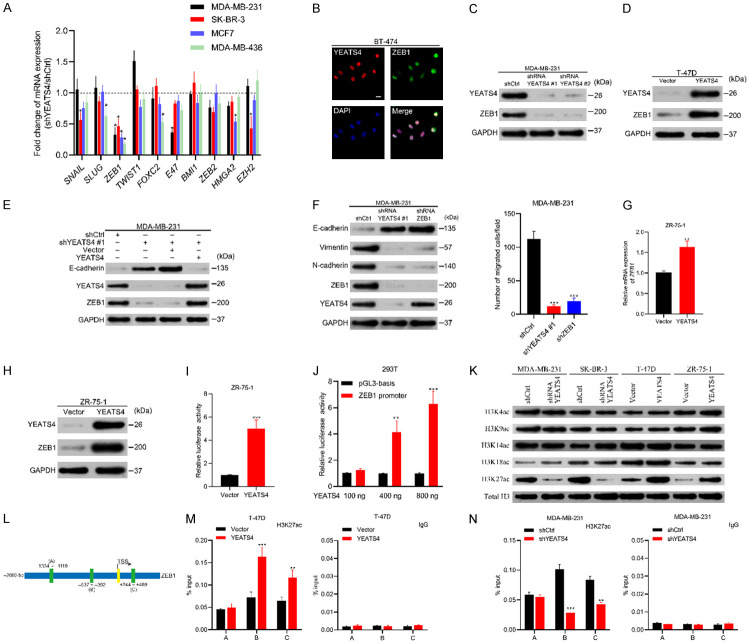
Figure 7.
YEATS4 regulates ZEB1 expression transcriptionally. (A) Fold changes in the mRNA expression levels of epithelial-to-mesenchymal transition (EMT) transcriptional factors in four breast cancer cell lines after YEATS4 depletion. Fold changes calculated by normalizing mRNA levels of YEATS4 deletion cells to that of the control cells. (B) Immunofluorescence images of YEATS4 and ZEB1 staining in BT-474 cells. YEATS4 and ZEB1 simultaneously expressed in cancer cells. Scale bar, 20 µm. (C) Expression of YEATS4 and ZEB1 in stable YEATS4-deleting MDA-MB-231 cells, determined by Western blot analysis. (D) YEATS4 and ZEB1 expression in YEATS4-overexpressing T-47D cells, detected by Western blot analysis. (E) Expression changes in ZEB1 and E-cadherin after restoring YEATS4 in YEATS4-deleting MDA-MB-231 cells. (F) Comparison of EMT markers and migration capabilities between YEATS4-deleting or ZEB1-deleting MDA-MB-231 cells and the control group. (G-I) ZEB1 mRNA (G), protein expression levels (H), and promoter activities (I) were investigated after 48 h transient transfection of YEATS4 overexpression or empty vector plasmids in ZR-75-1 cells. (J) Enhancement of the ZEB1 promoter activity by YEATS4 overexpression in a dose-dependent manner. (K) The abundance of H3 lysine acetylation was assessed by Western blot analysis; total H3 was used as a loading control. (L) Schematic of three regions relative to the ZEB1 transcription start site used as primers to test histone-occupied abundance. (M, N) ChIP was conducted to assess H3K27ac occupancy in T-47D-YEATS4 (M) and MDA-MB-231-shYEATS4 (N) cells. IgG was used as a negative control. Percentage of input indicates the ratio of the DNA fragment of each promoter region bound by H3K27ac to the total of the input DNA fragment without the H3K27ac antibody pull-down. Data are presented as mean ± s.d. for 3 independent assays. *, P < 0.05; **, P < 0.01; ***, P < 0.001.

