Figure 1.
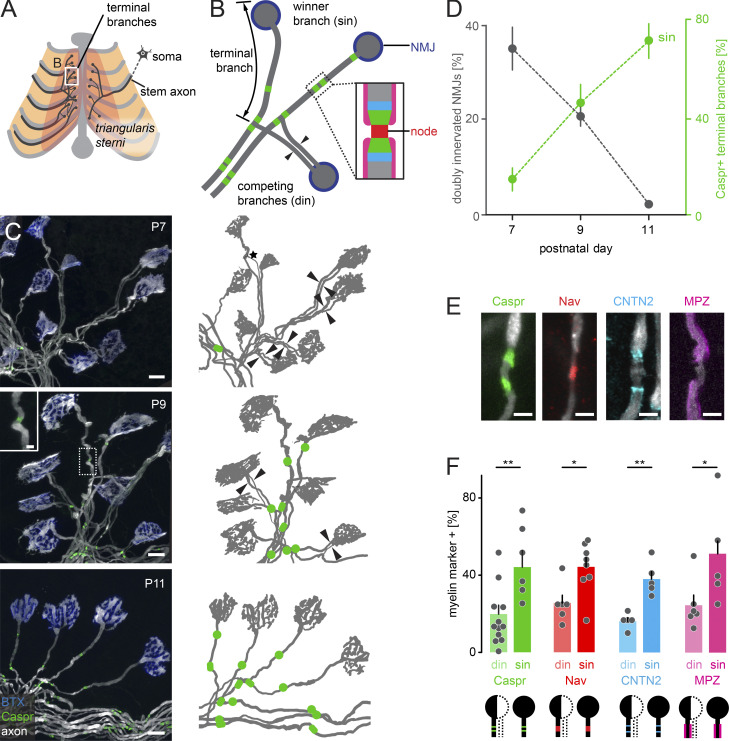
Myelination coincides with axon remodeling during the second postnatal week. (A) Schematic of thoracic nerve-muscle explant indicating anatomy of motor axons (dark gray), including the stem axon in the intercostal nerve, soma (motor neuron cell body in spinal cord), triangularis sterni muscle (pink), and sternum and ribs (light gray). The boxed area of terminal branches is schematized in more detail in B. (B) Schematic of terminal branches of motor neurons (dark gray), postsynaptic AChRs (NMJ; blue). Arrowheads point to two competing branches leading to the same NMJ; sin, winner branch. Regions of nodes of Ranvier include paranodes (green), node (red), and juxtaparanodes (cyan). SCs myelinate axons in internodal regions (magenta). (C) P7, P9, and P11 triangularis sterni muscles of Thy1-YFP16 mice (axon, white) immunostained for Caspr (green) and postsynaptic AChRs (BTX, blue). Inset shows an emerging paranodal Caspr cluster at P9. Corresponding schematics to the right show axons (gray) and Caspr-positive paranodes (green). Arrowheads point to two axons leading to the same NMJ. (D) Quantification of the percentage of doubly innervated NMJs at P7, P9, and P11 (n ≥ 5 mice, ≥100 NMJs per animal, gray) and the percentage of Caspr-positive terminal branches among singly innervated NMJs (n ≥ 5 mice, ≥100 NMJs per animal, gray) and the percentage of Caspr-positive terminal branches among singly innervated NMJs (n ≥ 7 mice, ≥30 branches per animal, green). (E) Nodes of Ranvier and myelin components show immunostaining for Caspr (green, paranode), Nav (red, nodal region), CNTN2 (cyan, juxtaparanode), and MPZ (magenta, myelin) in single terminal axon branches of Thy1-XFP mice (axons, white). (F) Quantification of the percentage of myelin initiation on winner (singly innervating [sin]) or competing (doubly innervating [din]) terminal axon branches for Caspr (green), Nav (red), CNTN2 (cyan), or MPZ (magenta; n ≥ 5 mice per group, ≥50 branches). Data represent mean ± SEM (D) or mean + SEM (F). *, P < 0.05; **, P < 0.01; Mann–Whitney test. Scale bars represent 10 µm (C, overview) and 2 µm (C, inset, and E).

