Figure 3.
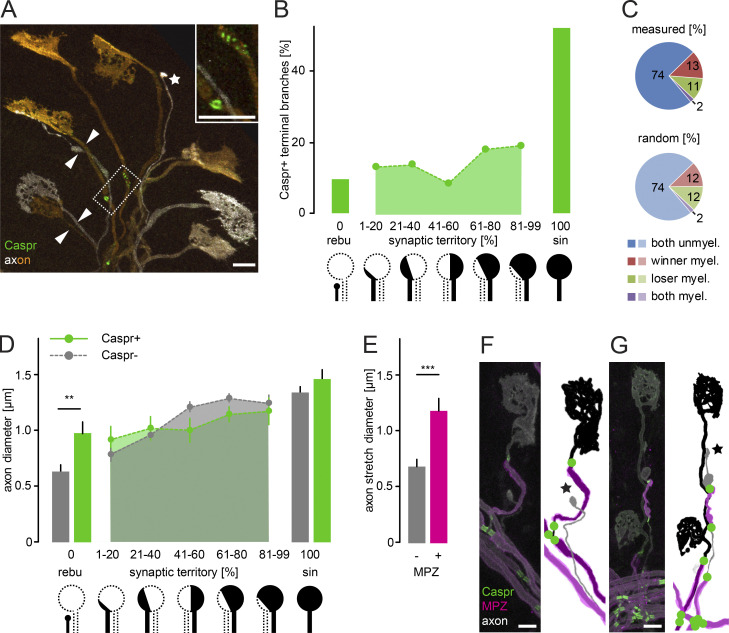
Myelination of competing branches neither biases competition nor reflects axon diameter. (A) Image of a fixed triangularis sterni muscle of a ChAT-IRES-Cre × Thy1-Brainbow-1.1 mouse. Motor units labeled with distinct fluorescence (axon, orange and white) and immunostained for Caspr (green); arrowheads point to competing branches, and asterisk marks a pruning axon. Inset shows enlarged dashed box with emerging dotty and more mature paranodal structures. (B) Quantification of Caspr immunostaining versus synaptic territory of competing branches (n ≥ 78 axons per group from a total of 69 mice). (C) Graph of measured myelination patterns on paired competing branches versus the calculated distribution assuming random myelin initiation. Winner is an axon branch ≤50% territory, while loser is ≥50% territory. (D) Quantification of an axon’s diameter versus its synaptic territory in axon branches either with (green) or without Caspr immunostaining (gray; n v 10 axons, v7 mice per group). (E) Quantification of the diameter of stretches on retreating axons with (magenta) or without MPZ-immunostaining (gray; n v 8 axons, ≥4 mice per group). (F and G) Images of Thy1-XFP terminal branches (axons, white) stained for Caspr (green) and MPZ (magenta). Schematics to the right depict a myelinated winning branch (black) versus a pruning axon (gray; star) without nodes (F) and a rare example of a myelinated retreating branch (gray; star) and its winning MPZ- and Caspr-negative competitor (black; G). rebu, retraction bulbs; sin, winner axons; (un)myel., (un)myelinated. Data represent mean ± SEM. **, P < 0.01; ***, P < 0.001, Mann–Whitney test. Scale bars, 10 µm (A, F, and G).

