Figure 4.
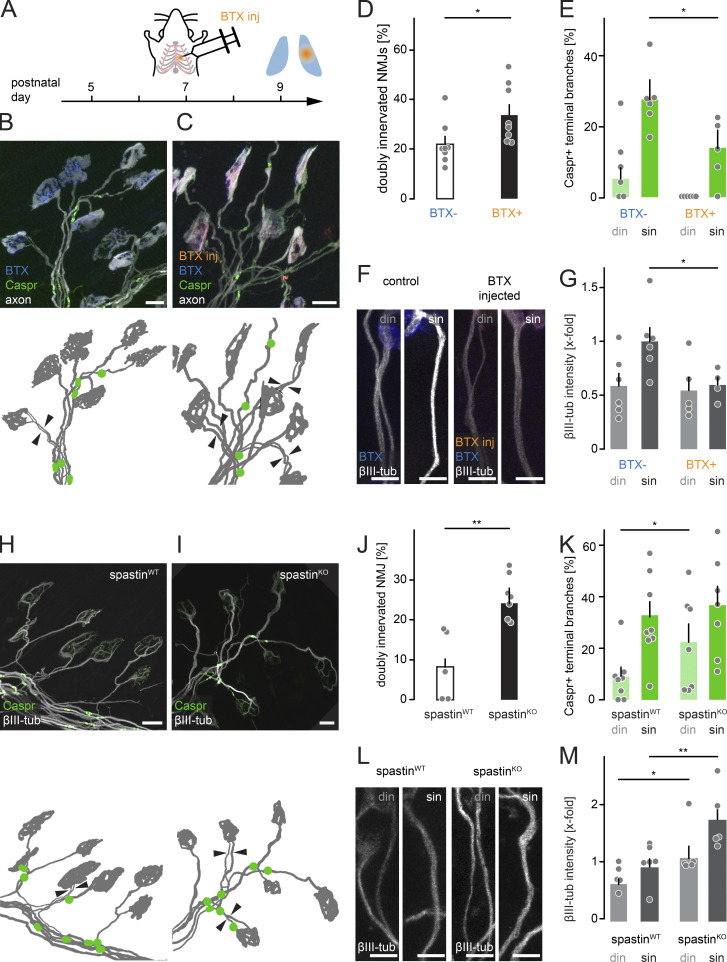
Neurotransmission and spastin differentially affect myelination and microtubular mass. (A) Schematic of experimental design. Thy1-YFP16 mice were unilaterally injected with BTX (“BTX inj”, orange) into the thoracic wall at P7, resulting in local blockade of AChRs. Fixed ipsi- and contralateral muscles are post hoc stained at P9 with BTX (blue) and immunostained for Caspr (green). (B and C) Contralateral control muscle (B) and ipsilateral BTX-injected muscle (C) showing axons (Thy1-YFP16, white), Caspr immunostaining (green), post hoc stained BTX (blue), and injected BTX (orange). Schematics below depict motor neurons (gray) and Caspr paranodes (green); arrowheads point to two competing axons leading to the same NMJ. (D) Quantification of doubly innervated NMJs at P9 following BTX injection (n = 8 mice, ≥50 axons per animal). (E) Quantification of Caspr-positive competing (din) and winner (sin) axon branches from BTX-injected muscles versus controls (n ≥ 5 mice, ≥32 axons per side of animal). (F) Images of competing (din) and winner (sin) terminal branches following BTX injection (orange) and post hoc staining at P9 with BTX (blue) and βIII-tubulin (white). (G) Quantification of βIII-tubulin intensity (x-fold normalized to Thy1-YFP16; n ≥ 5 mice, n ≥ 20 axons per side of animal). (H and I) P9 triangularis sterni muscle of littermate WT (H) and spastin KO (I) mice. Axons immunostained for Caspr (green) and βIII-tubulin (white). Corresponding schematics below show axons (gray) and Caspr-positive paranodes (green). Arrowheads point to two axons innervating the same NMJ. (J) Quantification of doubly innervated NMJs in P9 spastin KO animals compared with WT littermates (n ≥ 5 mice, n ≥ 70 axons per animal). (K) Quantification of Caspr-positive terminal branches in P9 spastin KO compared with WT littermates (n ≥ 7 mice, n ≥ 33 axons per animal). (L) Images of competing (din) and winner (sin) terminal branches in spastin WT and KO littermates, immunostained for βIII-tubulin (white). (M) Quantification of βIII-tubulin intensity (x-fold normalized to Thy1-YFP16) in spastin KO versus WT littermates (n ≥ 5 mice, n ≥ 13 axons per animal). din, competing axons; sin, winner axons. Data represent mean + SEM. Mann–Whitney test. *, P < 0.05; **, P < 0.01. Scale bars represent 10 µm (B, C, H, and I) and 5 µm (F and L).

