Figure S1.
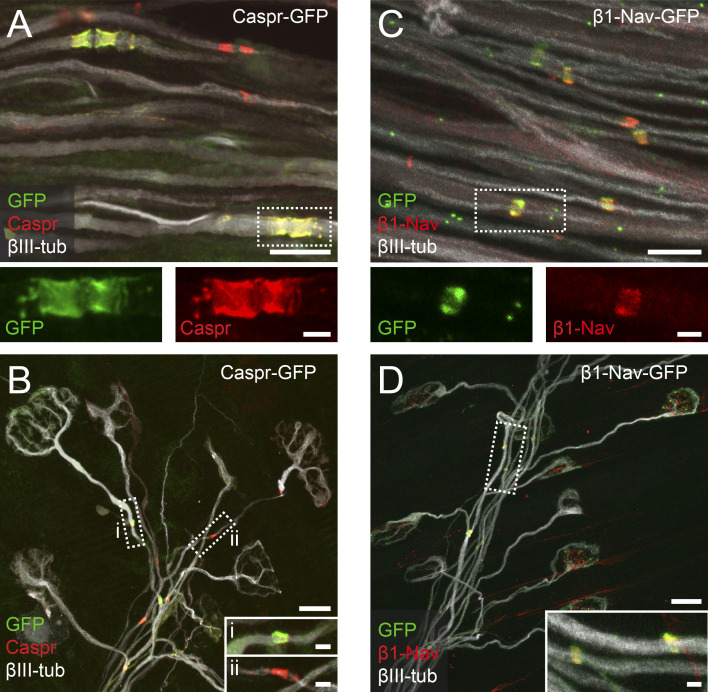
Characterization of Thy1-Caspr-GFP and Thy1-β1-Nav-GFP mice. (A) Confocal image of P9 Thy1-Caspr-GFP (native GFP, green) intercostal axons (βIII-tubulin, white) immunostained for Caspr (red). Dashed boxes enlarged below show single channels. The percentage of GFP-positive paranodes nodes was stable across development, suggesting consistent labeling of a neuronal subset (P9–P11: 65 ± 8% of all paranodal structures; 6 wk: 73 ± 9%; P = 0.7, Mann–Whitney test; n = 4 mice per age group, ≥44 nodes per animal). (B) Triangularis sterni muscle of a P9 Thy1-Caspr-GFP mouse immunostained for Caspr (red) and axons (βIII-tubulin, white). Dashed boxes enlarged below show Caspr/GFP double-positive (i) and Caspr-only–positive paranodes (ii). Expression of the Caspr-GFP transgene did not detectably influence the degree of double innervation (WT, 9 ± 1% vs. Caspr-GFP, 12 ± 2%; P = 0.4, Mann–Whitney test; n = 3 mice per genotype, ≥136 axons per animal) or myelination on terminal axon branches at P9 (winner branches: WT, 32 ± 2% vs. Caspr-GFP, 35 ± 8%; competing branches: WT, 12 ± 6% vs. Caspr-GFP, 7 ± 7%; P > 0.99, Mann–Whitney test; n = 3 mice per genotype, ≥31 axons per animal). (C) Image of P9 Thy1-β1-Nav-GFP (native GFP, green) intercostal axons (βIII-tubulin, white) immunostained for Nav (red). Dashed boxes enlarged below show single channels. All nodes identified by immunostaining were also GFP positive, indicating transgene expression in all motor neurons (100 ± 0%; n = 3 mice, ≥40 axons per animal). (D) Triangularis sterni muscle of a P9 Thy1-β1-Nav-GFP mouse immunostained for Nav (red) along terminal axon branches (βIII-tubulin, white). Insets show enlarged Nav/GFP double-positive nodes. Expression of the β1-Nav-GFP transgene did not detectably influence the degree of double innervation (WT, 11 ± 1% vs. β1-Nav-GFP, 14 ± 2%; n = 3 mice per genotype, ≥102 axons; P = 0.7, Mann–Whitney test; axons per animal) or myelination on terminal axon branches at P9 (winner branches: WT, 38 ± 8% vs. β1-Nav-GFP, 30 ± 4%; competing branches: WT, 19 ± 3% vs. β1-Nav-GFP, 11 ± 6%; P > 0.4, Mann–Whitney test; n = 3 mice per genotype, ≥31 axons per animal). din, competing axons; sin, winner axons. Scale bars represent 10 µm (A–D, overview) and 2 µm (insets).

