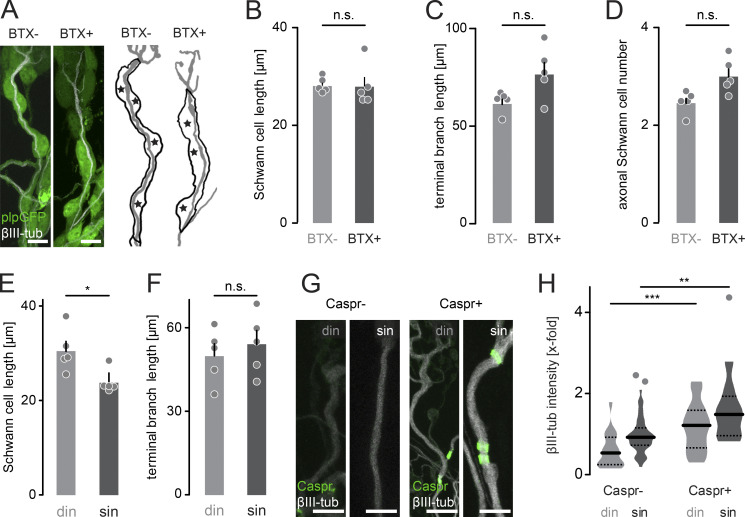
Figure S2.
Innervation and myelination status correlate with axonal tubulin content and SC length. (A) Images of SCs on singly innervating terminal branches in a Plp-GFP (green) mouse following BTX injection on P7 versus contralateral control side and post hoc staining at P9 with βIII-tubulin (white). Schematics to the right depict measured terminal axon length (gray) and SC outline with cell nuclei marked with asterisks. (B–D) Quantification of SC length (B), terminal branch length (C), and SC number (D) along singly innervating branches, showing no significant difference after BTX treatment in P9 Plp-GFP mice injected with BTX versus control (≥10 axons per animal in n = 5 mice). (E and F) Quantification of axonal SC length (E; din, 30 ± 2 µm; sin, 24 ± 1 µm) and terminal branch length (F; din, 50 ± 4 µm; sin, 54 ± 5 µm; ≥16 axons per animal in n = 5 mice). (G) Images of competing (din) and winner (sin) terminal branches in P9 Thy1-YFP16 mice, without or with emerging Caspr paranodes (green) and stained βIII-tubulin (white). (H) Quantification of βIII-tubulin intensity (x-fold normalized to Thy1-YFP16; Caspr negative, n ≥ 18 axons per group in n = 3 mice). din, competing axons; sin, winner axons. Data represent mean + SEM. *, P < 0.05; **, P < 0.01; ***, P < 0.001; ns., not significant; Mann–Whitney test. Outlier determined by Tukey test. Scale bar, 10 µm (A and G).

