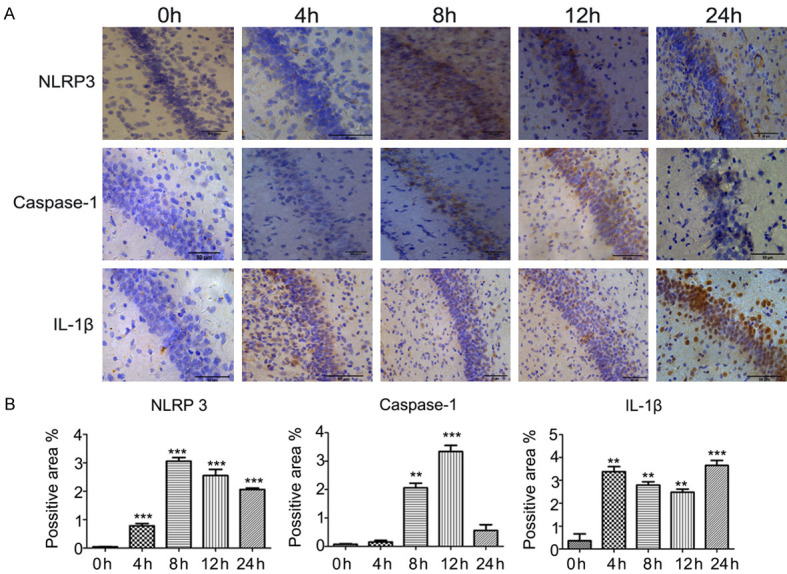
Figure 4.

Expression of NLRP3, caspase-1, and IL-1β proteins in brain tissue evaluated by immunohistochemistry. A. Representative images showing sections of brain tissue from the HI group stained using immunohistochemistry techniques. The expression levels of NLRP3, caspase-1, and IL-1β proteins were determined at 0 h, 4 h, 8 h, 12 h, and 24 h after surgery/hypoxia. B. Averaged semi-quantitative data comparing the expression levels of NLRP3, caspase-1, and IL-1β proteins between the various time points. **P < 0.01, ***P < 0.001 vs. 0 h.
