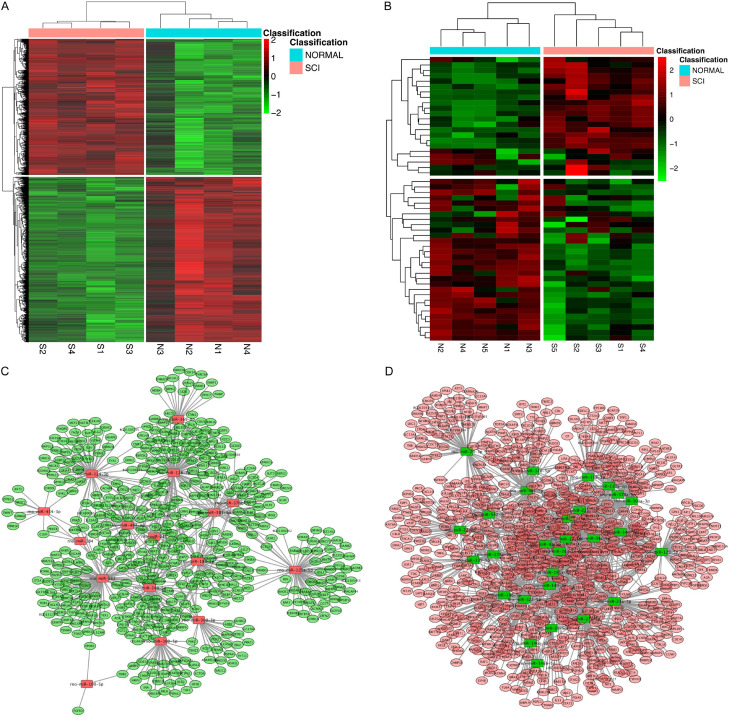
Figure 1.
Bioinformatics analysis of miRNA expression level in SCI rats. Gene expression data (GSE45006) and miRNA expression data (GSE19890) of rats and their control group were obtained from the NCBI database. (A, B) Heat map illustrating the expression level of protein coding gene (left) and miRNA (right) by the limma package (A), the array package and the limma package (B) in SCI. Red represents upwards and green represents downwards. (C, D) Screening comparisons were performed in three databases, miRDB, miRTarBase, and TargetScan, to analyze the candidate miRNAs that were up-regulated (C) and down-regulated (D) consistent with their potential target genes.

