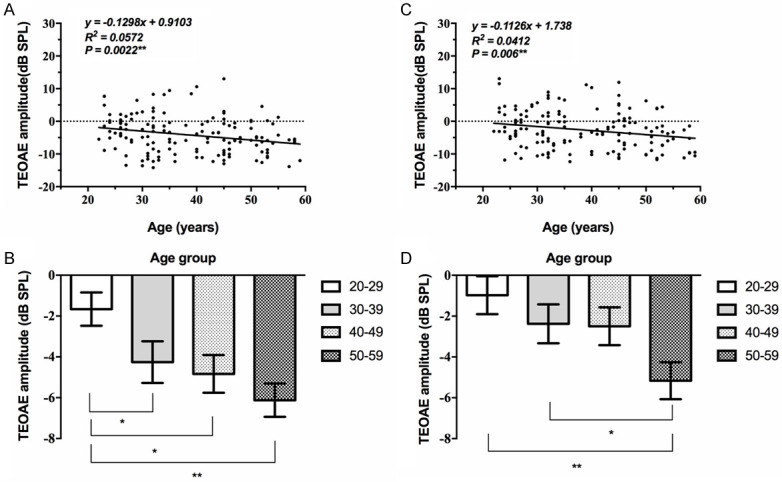
Figure 1.

Correlation between TEOAE amplitude and age. The TEOAE amplitude in quiet of both ears decreased with age, and showed a significant correlation (**, P<0.01). A, B: The TEOAE amplitude in quiet at the left ear. All age groups showed a deteriorating trend according to the histogram. C, D: The TEOAE amplitude in quiet at the right ear. All age groups showed a deteriorating trend according to the histogram (*, P<0.05; **, P<0.01).
