
Figure 4.
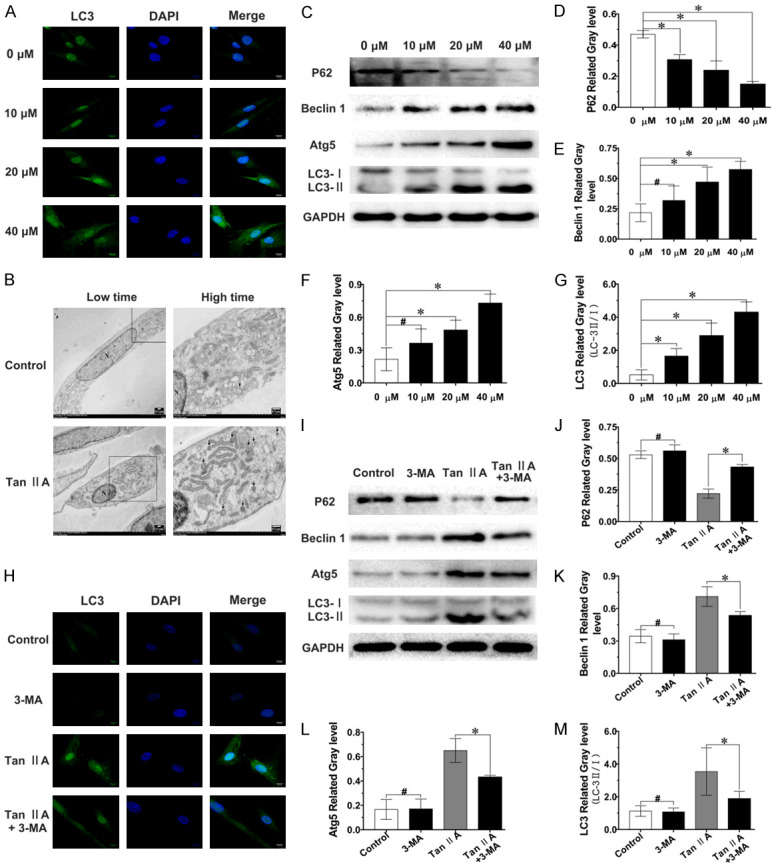
Tan IIA induced fibroblast autophagy, which was partially suppressed by 3-MA. A. Confocal images of LC3; scale bar, 10 μm. B. TEM images of a fibroblast autophagosome (black arrow) induced by Tan IIA treatment for 48 h. N, nucleus; scale bar, 0.5 μm. C-G. Expression levels of p62, Beclin 1, Atg5 and LC3-II/I were determined by western blot and quantified by normalization to GAPDH levels. H. Confocal images of LC3 after treatment with 3-MA and/or Tan IIA; scale bar, 10 μm. I-M. The expression of p62, Beclin-1, Atg5 and LC3-II/I was analysed by western blot, and the expression of p62, Beclin 1, Atg5 was quantified by normalization to GAPDH expression, the levels of LC3-II/I ratio is shown. Data are shown as the means ± SDs from three independent experiments; *P < 0.05; #P > 0.05.