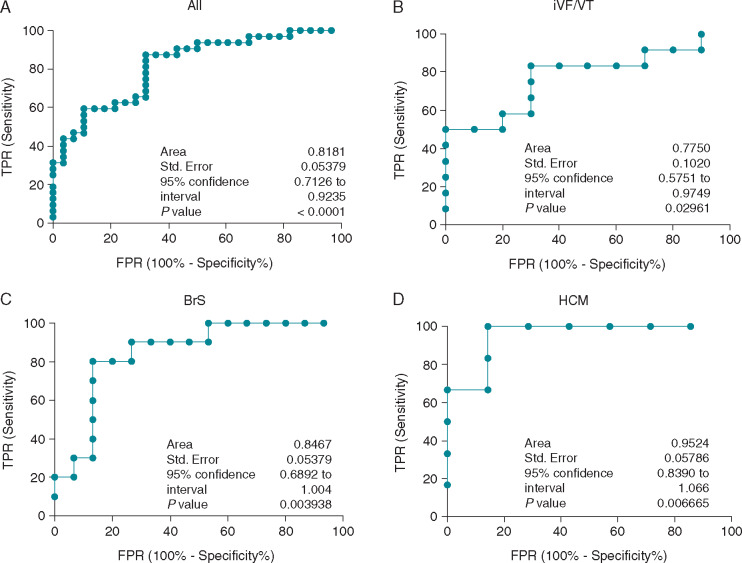
Figure 5.
ROC curves showing the predictive performance of the V-CoS test when applied to (A) all patients, (B) iVF/VT and structurally normal hearts, (C) Brugada syndrome, and (D) hypertrophic cardiomyopathy. BrS, Brugada syndrome; FPR, false positive rate; HCM, hypertrophic cardiomyopathy; iVF, idiopathic ventricular fibrillation; ROC, receiver operating characteristics; SCD, sudden cardiac death; TPR, true positive rate; V-CoS, ventricular conduction stability; VT, ventricular tachycardia.

