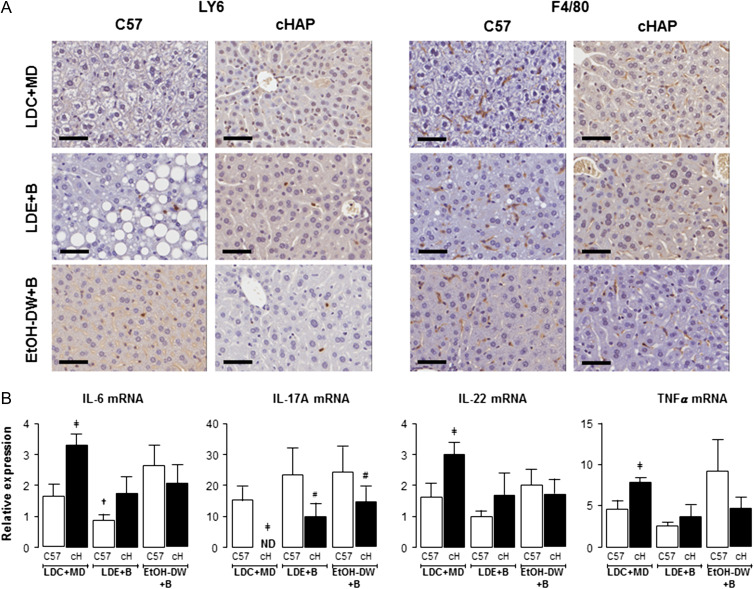
Fig. 3.
Effect of ethanol feeding on immune response varies depending on strain and ethanol feeding model. (A) Representative images of liver sections from C57BL/6 and cHAP mice following IHC to detect neutrophils (anti-LY6g antibody) and macrophages (anti-F4/80 antibody). Mice were maintained on either Lieber-DeCarli control liquid diet + maltose-dextrin (LDC+MD) (LDC), Lieber-DeCarli ethanol liquid diet+binge (LDE+B) or free access 10% (v/v) ethanol in DW + binge (EtOH-DW+B). Black bars = 50μm. (B) Hepatic IL-6, IL-17A, IL-22, and TNF-α mRNA was measured by qRT-PCR. ‡P < 0.05 cHAP LDC+MD versus C57 LDC+MD, #P < 0.05 strain-matched LDE+B or EtOH-DW+B versus LDC+MD. †P < 0.05 strain-matched LDE+B versus EtOH-DW+B. ND, not detected.

