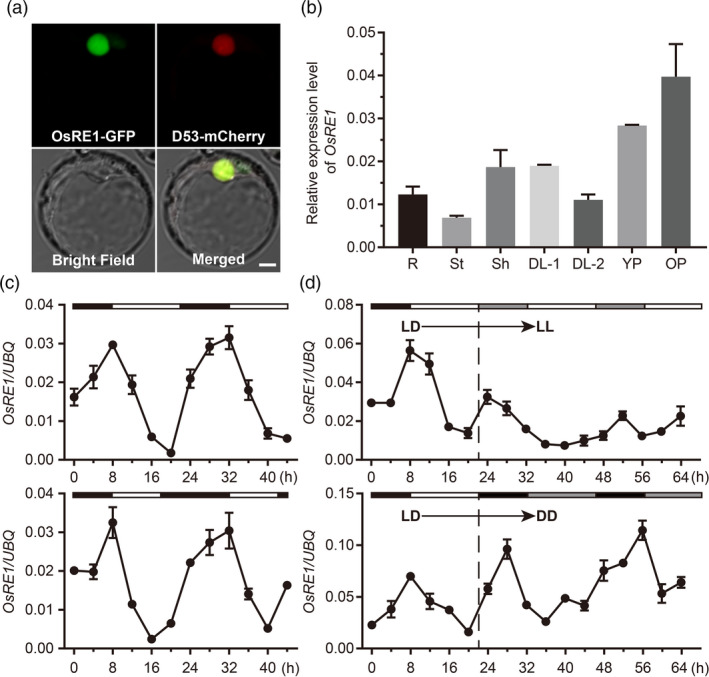
Figure 3.

Subcellular localization of OsRE1 and expression profiles of OsRE1. (a) Subcellular localization of OsRE1 in rice protoplasts. D53‐mCherry protein was used as a nuclear marker. Scale bar, 5 μm. (b) qRT‐PCR analysis of OsRE1 expression levels in different tissues. R, root; St, stem; Sh, sheath; DL‐1, uppermost leaves; DL‐2, second uppermost leaves; YP, young panicles; OP, old panicles. Values are means ± SD; n = 3. (c) Rhythmic expression of OsRE1 in second uppermost leaves under LD (14‐h light/10‐h darkness) and SD (10‐h light/14‐h darkness) conditions. Rice UBIQUITIN gene was used as the internal control. Values are means ± SD; n = 3. (d) Expression analysis of OsRE1 in second uppermost leaves under continuous light (LL) and continuous darkness (DD) conditions. The plants were grown in growth chambers under LD conditions for 30 days and then transferred to LL or DD conditions for 2 days. Black and white bars indicate darkness and light, respectively. Grey bars represent the subjective darkness in DD and subjective light in LL. Rice UBIQUITIN gene was used as the internal control. Values are means ± SD; n = 3. [Colour figure can be viewed at wileyonlinelibrary.com]
