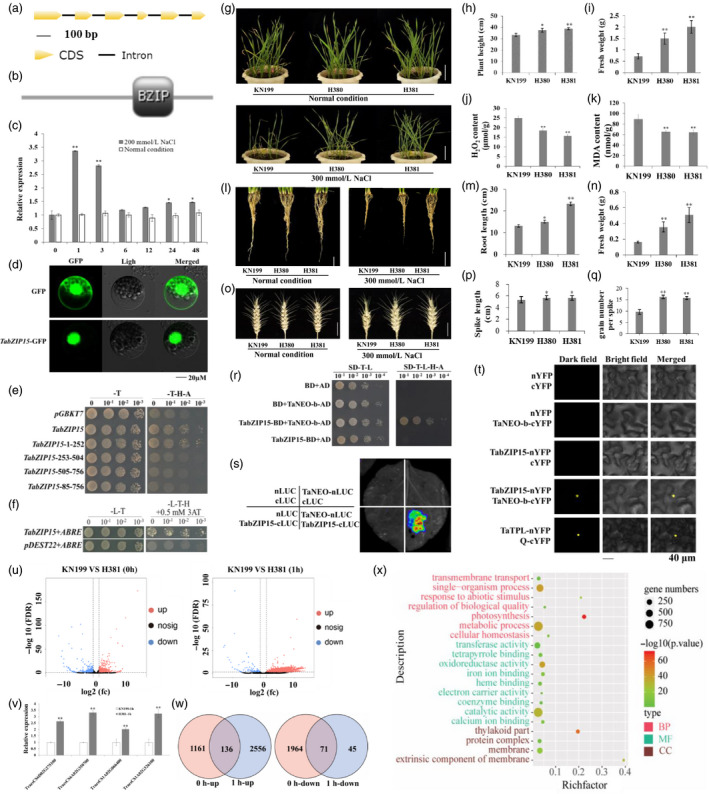
Figure 1.

Functional characterization of TabZIP15 in the regulation of salt stress in wheat. (a and b) Schematic of the TabZIP15 gene structure (a) and its putative coding protein (b). (c) Expression patterns of the TabZIP15 gene in roots at different time points after salt stress treatment at the seedling stage. (d) Subcellular localization of the TabZIP15 protein in wheat leaf protoplasts. (e) Test of the transcriptional activity of the full‐length and truncated fragments of TabZIP15. (f) TabZIP15 binds specifically to the ABRE Cis‐element in yeast cells. (g) Phenotypes of KN199 and TabZIP15 transgenic plants under normal and salt stress conditions. Bars = 10 cm. (h‐k) The plant height (h), aboveground fresh weight (i) and malondialdehyde (MDA) (j) and H2O2 contents (k) of seedlings under the salt stress condition. (l) Root phenotypes of KN199 plants and TabZIP15 transgenic wheat plants under normal and salt stress conditions. Bars = 5 cm. (m and n) The length (m) and fresh weight (n) of roots under the salt stress condition. (o) Spike phenotypes of KN199 and TabZIP15 transgenic plants in the reproductive stage under normal and salt stress conditions. Bars = 2 cm. (p and q) The spike length (p) and grain number per spike (q) of KN199 and TabZIP15 transgenic plants under the salt stress condition. (r) Yeast two‐hybrid assay shows that TabZIP15 interacts with TaENO‐b. (s and t) Firefly luciferase complementation imaging (s) and bimolecular fluorescence complementation (t) assays confirming the interaction between TabZIP15 and TaNEO‐b. Two known interacting proteins, TaTPL and Q, were used as positive controls. (u) Differentially expressed genes (DEGs) between KN199 and H381 plants at 0 h and 1 h after salt stress treatment, as shown by volcano plots. (v) Four genes were selected to verify the transcriptome results. (w) Venn diagrams demonstrating the comparison of the up‐regulated and down‐regulated DEGs between 0 h and 1 h after salt stress treatment. (x) Gene Ontology enrichment analyses of the DEGs whose expression was up‐regulated specifically at 1 h after salt stress treatment in H381 plants. BP: biological process, MF: molecular function, CC: cellular component. [Colour figure can be viewed at wileyonlinelibrary.com]
