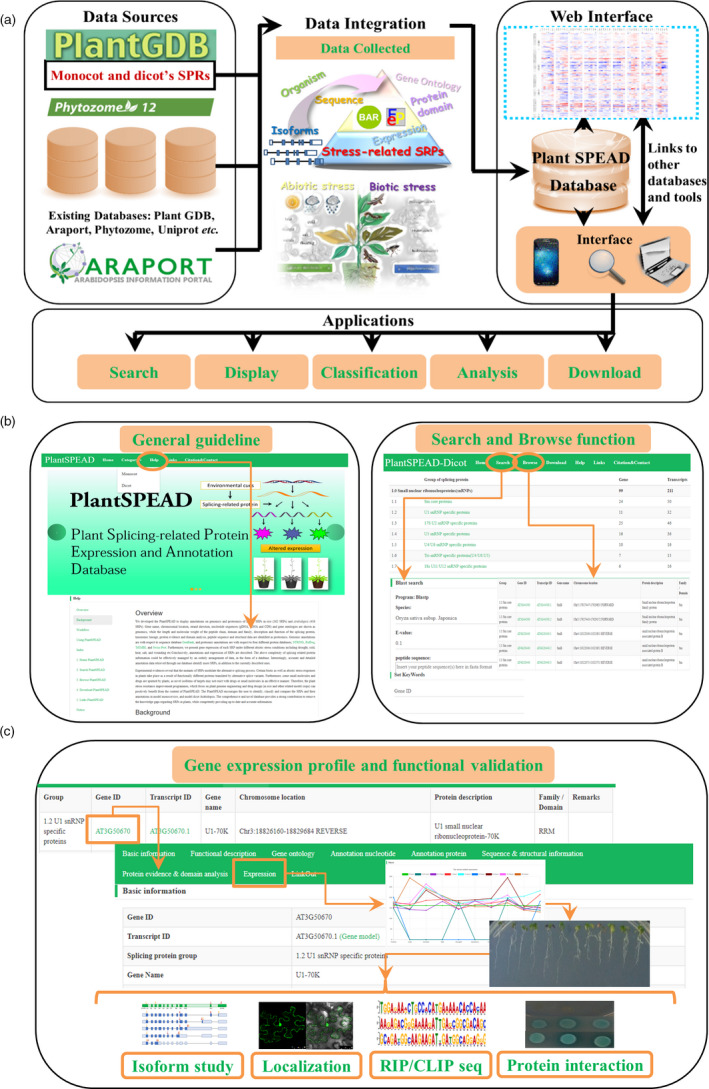
Figure 1.

Structure, data and function of PlantSPEAD. (a) The data sources, data integration, web interface and potential applications of this database. (b) Illustration of the organization between the General guideline, Browse and Search pages in the PlantSPEAD web interface. (c) Example of how to locate a potential stress‐related plant SRP and of a follow‐up experimental design to study its biological function. [Colour figure can be viewed at wileyonlinelibrary.com]
