Figure 2.

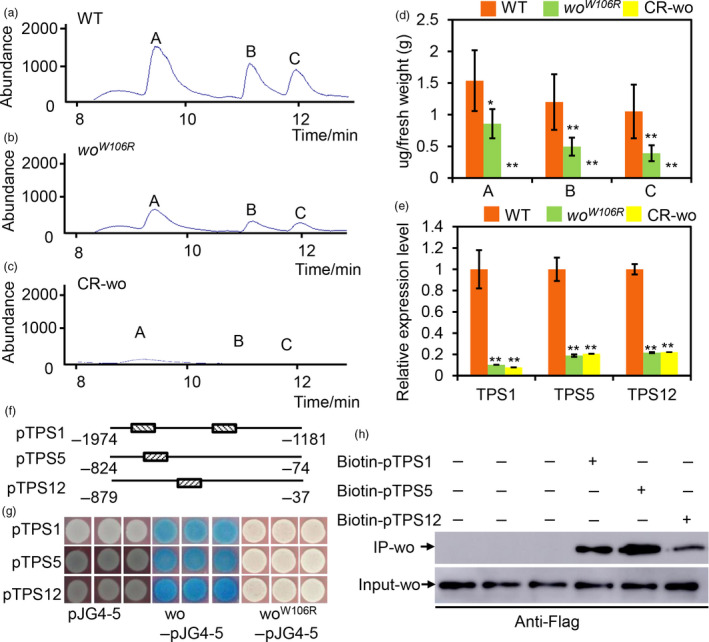
woolly directly regulates the terpene biosynthesis. (a–c) GC‐MS chromatograms of the leaves of WT (A), woW106R mutant (b) and CR‐wo plants (c). a: 2‐Carene; b: β‐Phellandrene; c: α‐humulene. (d) The quantification of terpenes base on the GC‐MS analysis. The Y‐axis represents the content of the terpenes (μg) per gram (g) of the fresh leaf. Values are represented as means ± SD (n = 5). Asterisks indicate significant differences by t‐test: **P < 0.01, *0.01 < P < 0.05. (e) Relative expression level of TPS1, 5 and 12 in the gland of type VI trichomes of WT, woW106R mutants and CR‐wo mutants. Values are represented as means ± SD (n = 3). Asterisks indicate significant differences by t‐test: **P < 0.01, *0.01 < P < 0.05. (f) The promoter region of TPSs bound by wo is represented by the narrow line. The box filled with the slash indicates the L1 box. The number shows the location of the promoter. (g) Y1H shows that wo binds to the promoter fragments of TPS genes. The full‐length coding sequence of wo and woW106R was cloned into the vector pJG4‐5 (marked as wo‐pJG4‐5 and woW106R‐pJG4‐5). The promoters of TPSs were cloned into the vector pLacZi. Empty vector pJG4‐5 was used as the negative control. The transformed yeast cells were incubated on SD/‐Trp‐Ura + X‐gal medium. The blue clones indicate the interaction between the proteins and the promoters. (h) The biotin‐labelled DNA IP assay. The negative control is in the left three lanes in which the beads were incubated with the total protein. The anti‐Flag antibody was used for the immunoblotting of Flag‐wo. [Colour figure can be viewed at wileyonlinelibrary.com]
