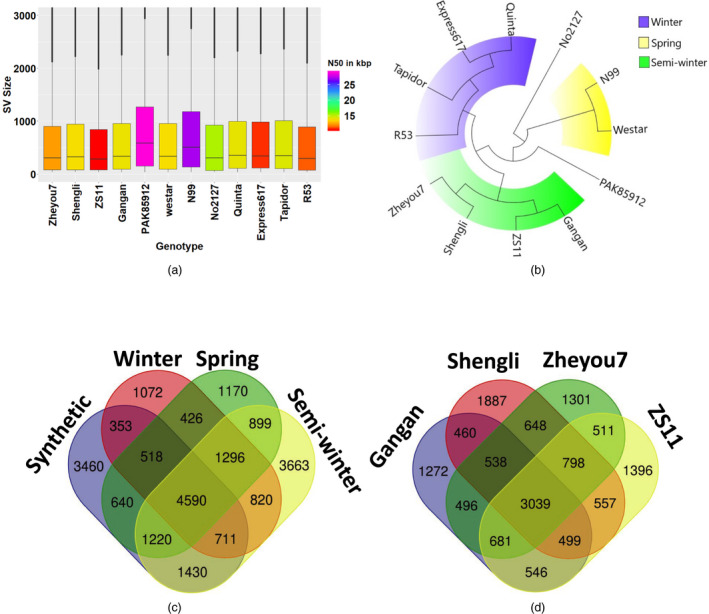
Figure 1.

Gene scale SV in oilseed rape. (a) Box plots showing size distributions of SV events detected in 12 B.napus genotypes. (b) Maximum‐likelihood tree showing genetic relationships among 12 B. napus genotypes based solely on genome‐wide SV events, revealing clear clustering into the appropriate eco‐geographical morphotype groups. (c) Venn diagram showing the numbers of common or unique genes carrying intragenic SV events across three divergent ecotypes and synthetic B. napus, respectively. (d) Venn diagram representing the numbers of common or unique genes carrying intragenic SV events across four semi‐winter B. napus accessions.
