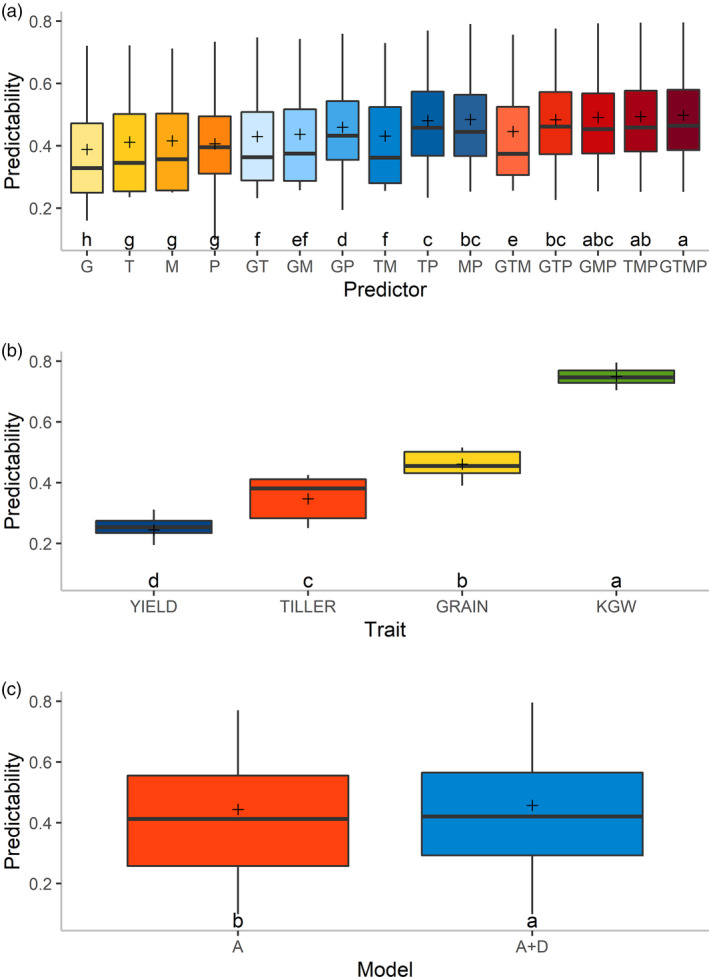
Figure 3.

Multiple comparisons of predictabilities illustrated by boxplots. In each boxplot, different letters (in lower case) above the group labels indicate significant differences between groups. Positions of the plus sign represent the mean predictabilities. (a) Comparison of mean predictabilities of 15 predictors across four traits and two models. (b) Comparison of mean predictabilities for the four traits across 15 predictors and two models. (c) Comparison of mean predictabilities of the two models across 15 predictors and four traits. [Colour figure can be viewed at wileyonlinelibrary.com]
