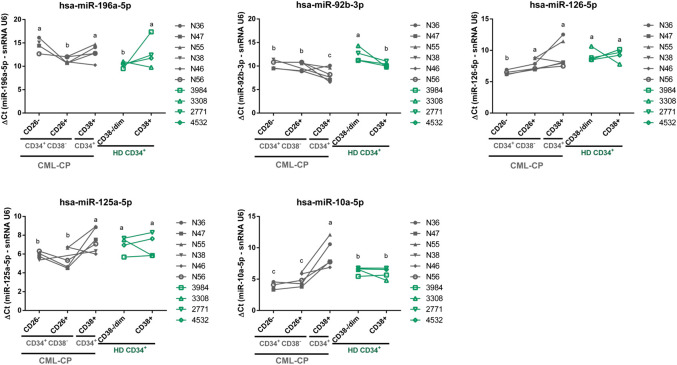
FIGURE 4.
Validation of microRNAs by RT-qPCR in a new cohort of CML-CP and HD samples. Results are expressed as ΔCt = Ct (microRNA) − Ct (snRNA U6). Each dot is the mean of technical duplicates from each patient or HD. CML-CP samples are represented in grey symbols, and HD samples in green symbols. Lines connect different fractions from the same patient or HD. Different letters indicate statistically significant differences (linear mixed-effects model, a posteriori comparison, global α = 0.05).

