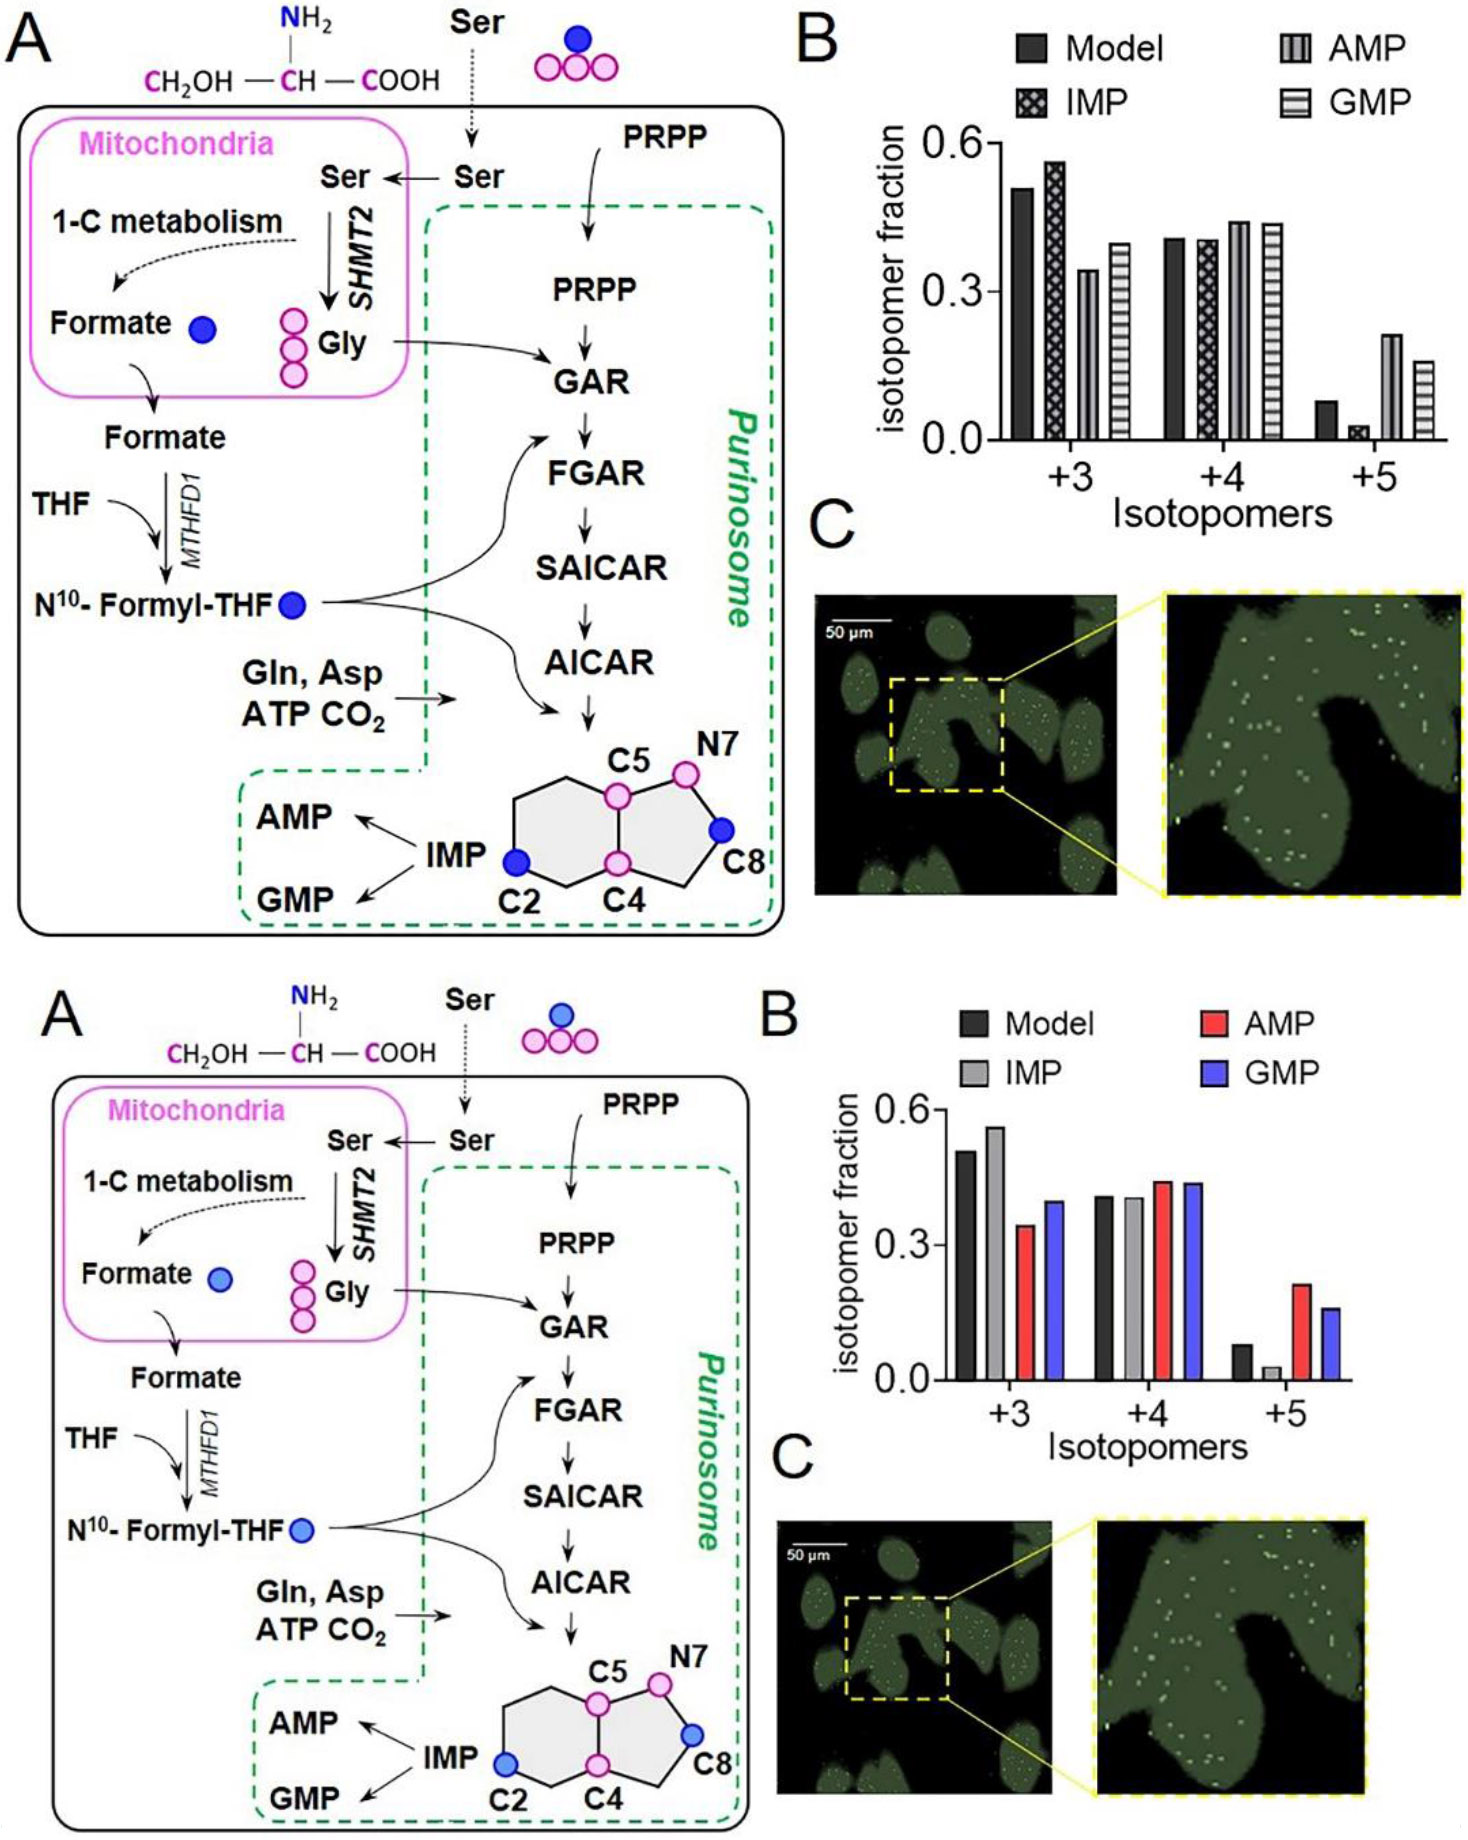
Figure 4. HeLa cells show channeled DNPB.

(A) In three separate steps upstream of IMP, 13C3, 15N Ser derived labeled 13C2, 15N Gly and 13C formate get incorporated into the intermediates and the end-product purines synthesized by DNPB, allowing monitoring of cellular DNPB flux. The unique isotopomer species in IMP, AMP, and GMP- +3, +4, and +5- all have one 13C2, 15N Gly; and 0, 1 or 2 13C formate incorporations, respectively. For clarity, only the relevant steps and intermediates are shown. Blue circles: 13C labeled β-carbon of Ser; pink circles: 13C, 15N labeled Ser backbone atoms. (B) The fractional abundance of the de novo synthesized purine isotopomers, +3, +4, and +5 can be predicted assuming uniform cytosolic abundance of the labeled substrates; a similar distribution of the three isotopomers is to be expected for IMP and all the downstream purines, including AMP and GMP. While the isotopomeric distribution of IMP closely resembles the model, AMP and GMP show a different isotopomeric distribution. The underlying reason being a higher labeled Gly and formate enrichment in AMP and GMP compared to that predicted by the model. Data from one representative experiment are shown. (C) A representative GCIB-SIMS image of purine depleted HeLa cells grown in 15N Ser supplemented medium to allow 15N label incorporation in purines. Overlay of the pixels with high 15N AICAR abundance (white) and cell image generated using total ion current (green) is shown. A zoomed-in view shows the spatial distribution of AICAR ‘metabolic hotspots’ in a region of interest highlighted with yellow box in (C). Figures are prepared from the data originally reported and presented in (Pareek et al., 2020).
