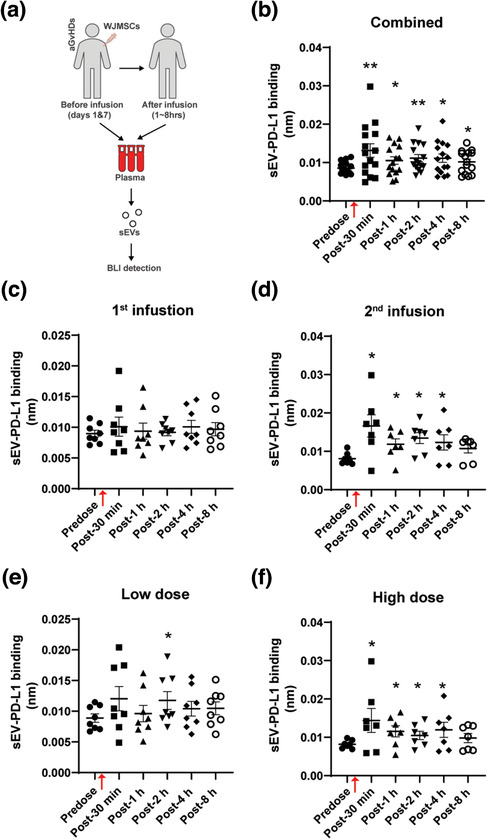
FIGURE 5.

Clinical WJMSC infusion increases plasma sEV‐PD‐L1 in aGvHD patients. (a) Schematic of measuring plasma sEV‐PD‐L1 in aGvHD patients clinically received WJMSCs. Patients’ plasma samples were collected before (predose) and after (post) WJMSC transplantation within 8 h, sEVs were isolated from these plasma samples, and PD‐L1 on sEVs was examined by BLI. (b‐f) Quantitative analysis for combined patients (b, n = 15) and partial patients received with either 1st infusion (c, n = 8), 2nd infusion (d, n = 7), low dose: 1.2 × 10⁶ cells/kg (e, n = 8), or high dose: 10 × 106 cells/kg (f, n = 7). WJMSC infusion time points were indicated by red arrows (b‐f). Data are mean ± s.e.m. and analysed by unpaired one‐tailed Student's t‐test (b‐f). * P < 0.05, ** P < 0.01, *** P < 0.005
