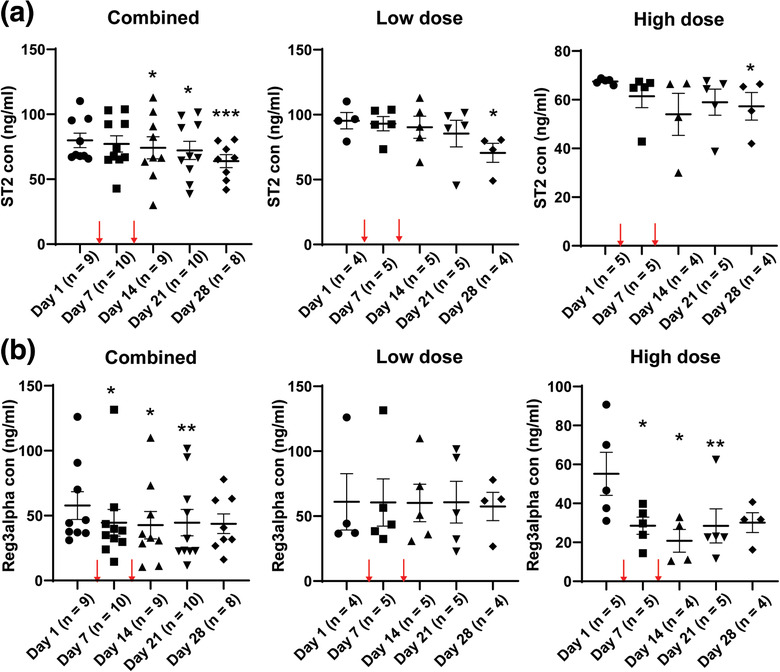
FIGURE 6.

Decreased plasma ST2 and REG3A levels in aGvHD patients with WJMSC infusion. (a,b) ELISA of ST2 (a) and REG3A (b) in the plasma samples from aGvHD patients with the WJMSC infusion. Left, combined analysis; Middle, low‐dose (1.2 × 10⁶/kg WJMSCs); Right, high‐dose (10 × 106/kg WJMSCs). Two cell infusion time points were indicated by red arrows (a,b). Data are mean ± s.e.m. and analysed by unpaired one‐tailed Student's t‐test (a,b). * P < 0.05, ** P < 0.01, *** P < 0.005
