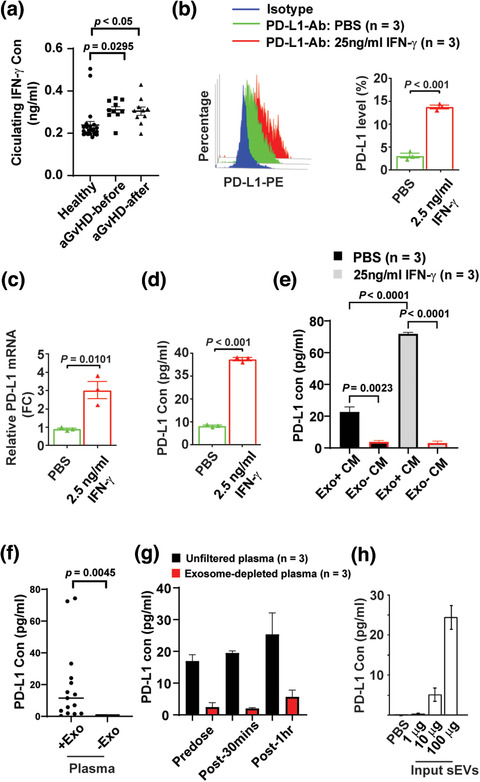
FIGURE 7.

IFN‐γ induces the sEV‐PD‐L1 release from WJMSCs. (a) Quantitation of IFN‐γ in the plasma samples of healthy donors (n = 23) and aGvHD patients (n = 10) before or after WJMSC infusion, measured by ELISA. (b) Flow cytometry of PD‐L1 protein on the WJMSCs induced by 2.5 ng/ml IFN‐γ (left) and quantitative analysis (right, n = 3). (c) Quantitation of PD‐L1 mRNA in the WJMSCs from b (n = 3). (d), ELISA of PD‐L1 secreted from the WJMSC from b (n = 3). (e) PD‐L1 in both complete conditioned medium (Exo+ CM) and exosome‐depleted conditional medium (Exo‐ CM) from WJMSCs licensed by IFN‐γ (n = 3). (f,g) Quantitation of PD‐L1 in unfiltered or exosome‐depleted human plasma samples. Exosome‐free human plasma was generated by either ultracentrifugation (F, n = 3) or Amicon Ultra‐4 centrifugal filters (n = 3). (h) ELISA of PD‐L1 on WJMSC‐derived sEVs (n = 15). Data are mean ± s.e.m. and analysed by unpaired one‐tailed Student's t‐test (a‐h)
