FIGURE 8.

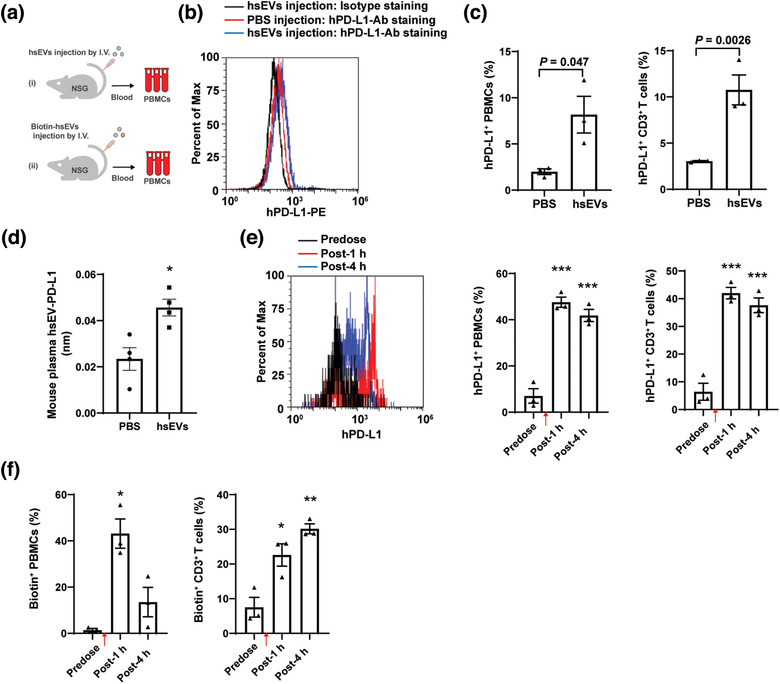
In vivo binding of human WJMSC sEVs on mouse PBMCs. (a) Schematic of intravenously administrating 4 mg/kg sEVs (i) or Biotin‐labelled sEVs (ii) to immunodeficient NOD scid gamma (NSG) mice. (b) Flow cytometry of human PD‐L1 on the cell surface of PBMCs from NSG mice administrated by PBS or sEVs for 12 h. (c) Quantitation of human PD‐L1 on mouse PBMCs (left, n = 3) and CD3+ T cells (right, n = 3) from b. (d) Quantitative analysis of human sEV‐PD‐L1 in mouse plasma samples from b (n = 4). (e) Flow cytometry showing human PD‐L1 on mouse PBMCs from NSG mice before and after WJMSC sEV injection (left) and quantitation (right, n = 3). (f) Quantitative analysis of biotin labelled WJMSC sEVs (Biotin+) on mouse PBMCs (left, n = 3) and CD3+ T cells (right, n = 3), measured by flow cytometry. Human WJMSC sEVs infusion time points were indicated by red arrows (d,e). Data are mean ± s.e.m. and analysed by unpaired one‐tailed Student's t‐test (c‐f). * P < 0.05, ** P < 0.01, *** P < 0.005
